


06-23 Intraday trading review

Chat has not been working well for me so I’m writing this here instead….
Let’s start off with the SPX Gameplan chart that I publish in TradingView (Link is posted in substack chat for paid subscribers).

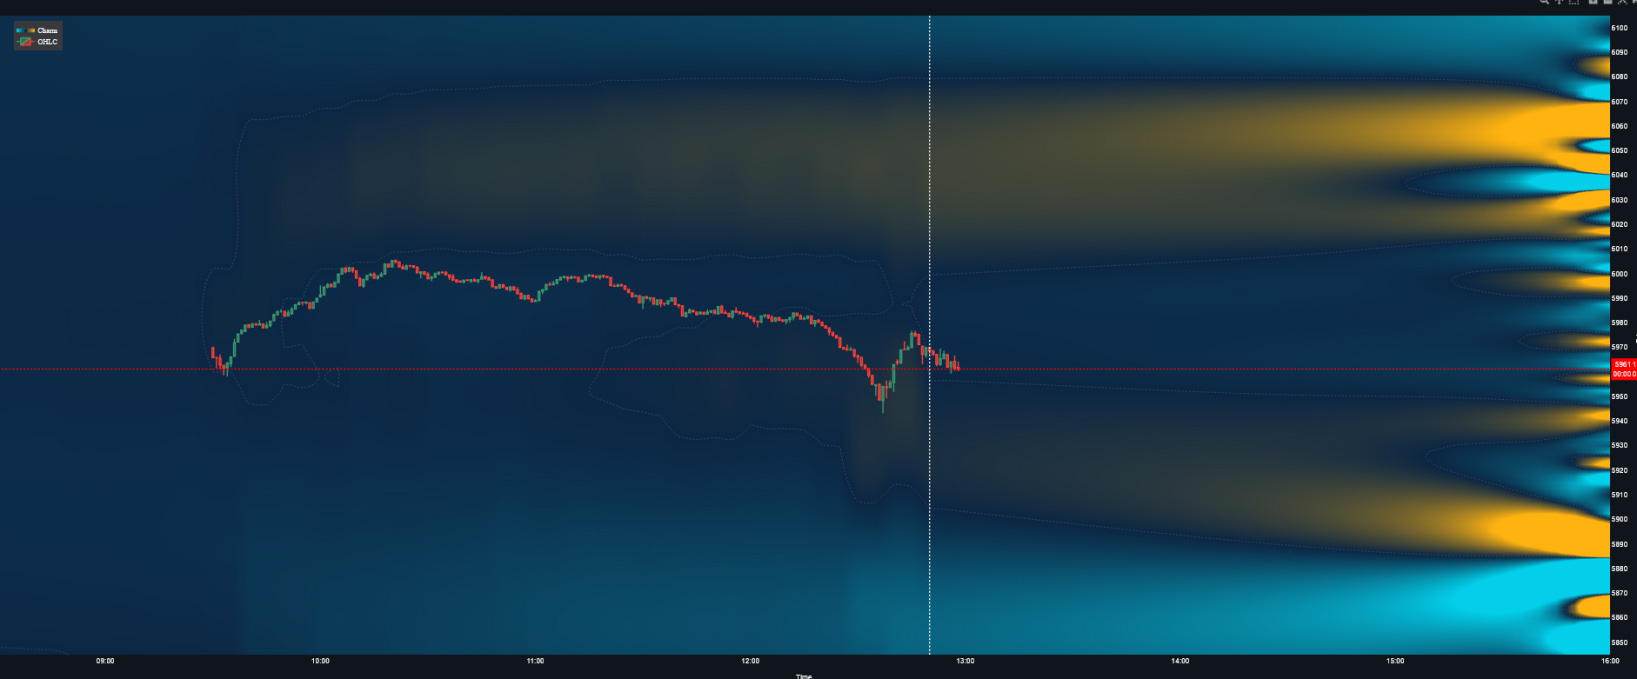
The day opened and we immediately saw a strong move higher…. 40 pts higher as a matter of fact. As a reminder… I really don’t like to trade the first 30 minutes or so of Monday open but this move hurt!
Please note the Dark green line…. “6000 - Rejection or Acceleration
Short Gamma Trough”
What happened this morning when we got there? we stalled and reversed a bit and chopped….
at 1011 EST, I posted this
At 1027, I posted this
at 1056 I posted this
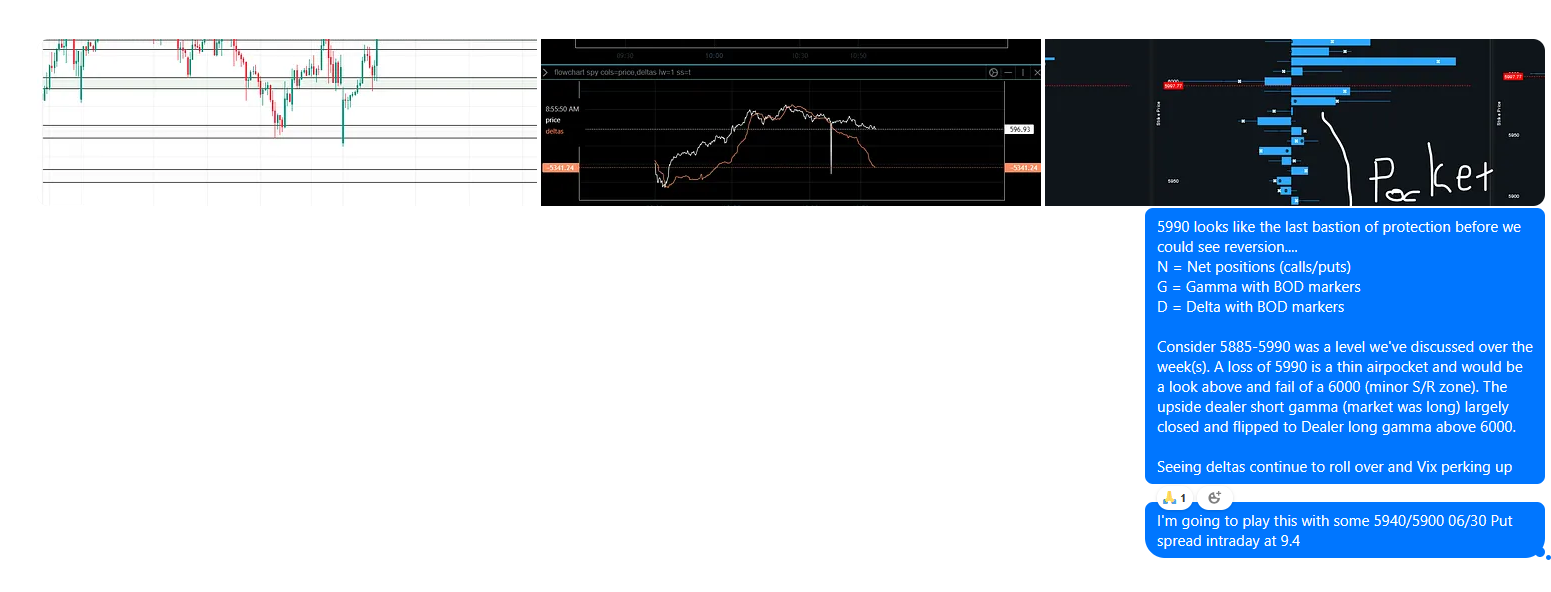
at 1125 (after entering the put spreads), I noted this

A thin profile means you can see some rapid PA if price breaks under a level.
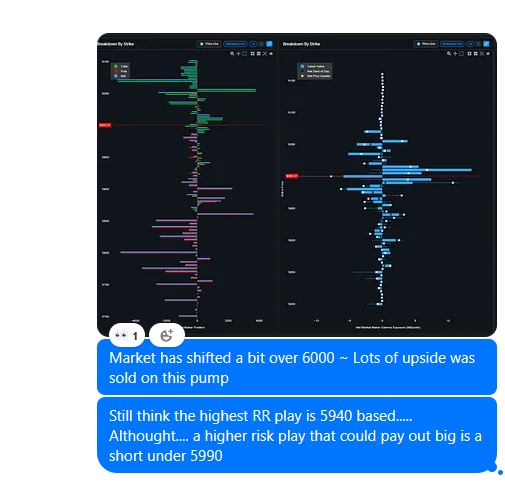
Let’s take a step back and dive into why I saw reversion and played it like I did.
On 06/18, I noted the large 6/27 Put butterflies on SPX centered on 5905 (JPM EOQ strike)
I reiterated those every day…. I wanted to make it known that very large players were looking for reversion. Guess what (they’re still open!)
We saw the stall at 6000 ~ Interesting that I posted Rejection or Acceleration there
In the back of my mind, I kept seeing that very hedged 0DTE Dealer net positioning chart showing short gamma puts all the way down to 5800.
Thin profile under 5990 (I noted it’s the last bastion of protection).
Take the above points and piece them together…. Downside 0DTE focus, Stalled upside price moevement, large focus on the EOQ JPM collar for this Friday by a large player (7k contracts at ~500$ a piece…. pretty sizable bet even for Mithril!).
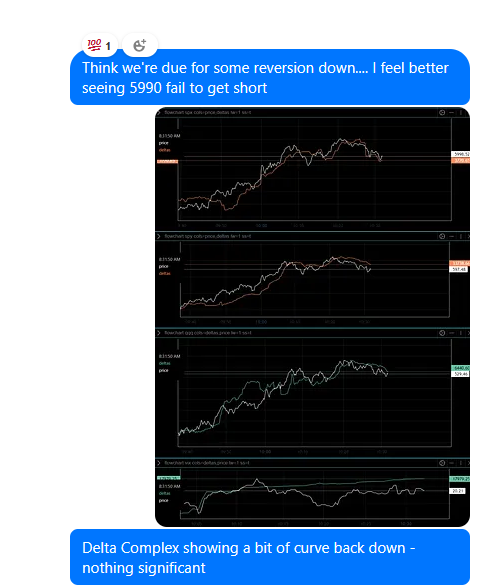
The rest is history…. Consider what happened. Iran shot some missiles (after the fact the US said Iran reached out through diplomatic channels before hand … all this geopolitical stuffi s noise).
Ok… now to the 5955 bounce….
I posted this snapshot of positioning at 1201 EST

I posted this at SPX 5970 at 1226 EST

We got a deeper flush of 5955 into 5940’s but remember on knife catches, you want to see the price reclaim before going long.
At this point, I started having issues posting pictures (this picture shows on my end)
The text would not post but was supposed to read… if we can’t break under 5950, we’re going to back up towards 9580/5985 for close. Granted we’re much higher than that estimate, it’s largely from positioning that has rolled off and opened after we started the climb higher.
Let’s take a step back and dive into why I saw 5955 as a bounce.
On 06/18, I noted the large 6/27 Put butterflies on SPX centered on 5905 (JPM EOQ strike) ~ This implied large dealer short gamma at 5955 for Friday.
Dealer Long gamma at 5955.
Large S/R Zone at 5955-5960 (I’ve posted this SPX(Spreadex chart) in Chat alot!


So …. a bit of tracking positions, seeing the long gamma, and understand our big picture S/R zones led me to call out the 5955 bounce area.
Post questions in comments.