


I’ve often found myself asking, “why would I buy a stock breaking out of a technical downtrend or breaking all time highs when there are plenty of stocks which I can dumpster dive instead?”
Well… trying to time the bottom on a stock in free fall sounds sexy - Think of the returns if you can nail the bottom and grab the bounce! Could it be that the market is wrong and the business is great? Sure…. but there’s a few considerations I want to present to you around buying breakouts - be it all time high breakouts or trend breakouts.
Momentum Investing
Trend continuation: When a stock breaks out of a long-established trend or reaches a new all-time high (or all-time low), it often signals strong momentum as price goes up when there are more buyers than sellers. Conversely, when price falls to all-time lows or breaks a support line, there are more sellers than buyers at this level. Momentum investing revolves around the idea that rising stocks continue to rise and falling stocks continue to fall. In simple terms, This is investing using Newton’s first law of momentum (law of inertia) where an object in motions stays in motion.
After all, what’s breaking an imaginary line on a chart between friends…..I believe this is one of the underlying ideas of some technical analysis.
While this example GGAL 0.00%↑ isn’t an ATH breakout, it is a great example of momentum investing.
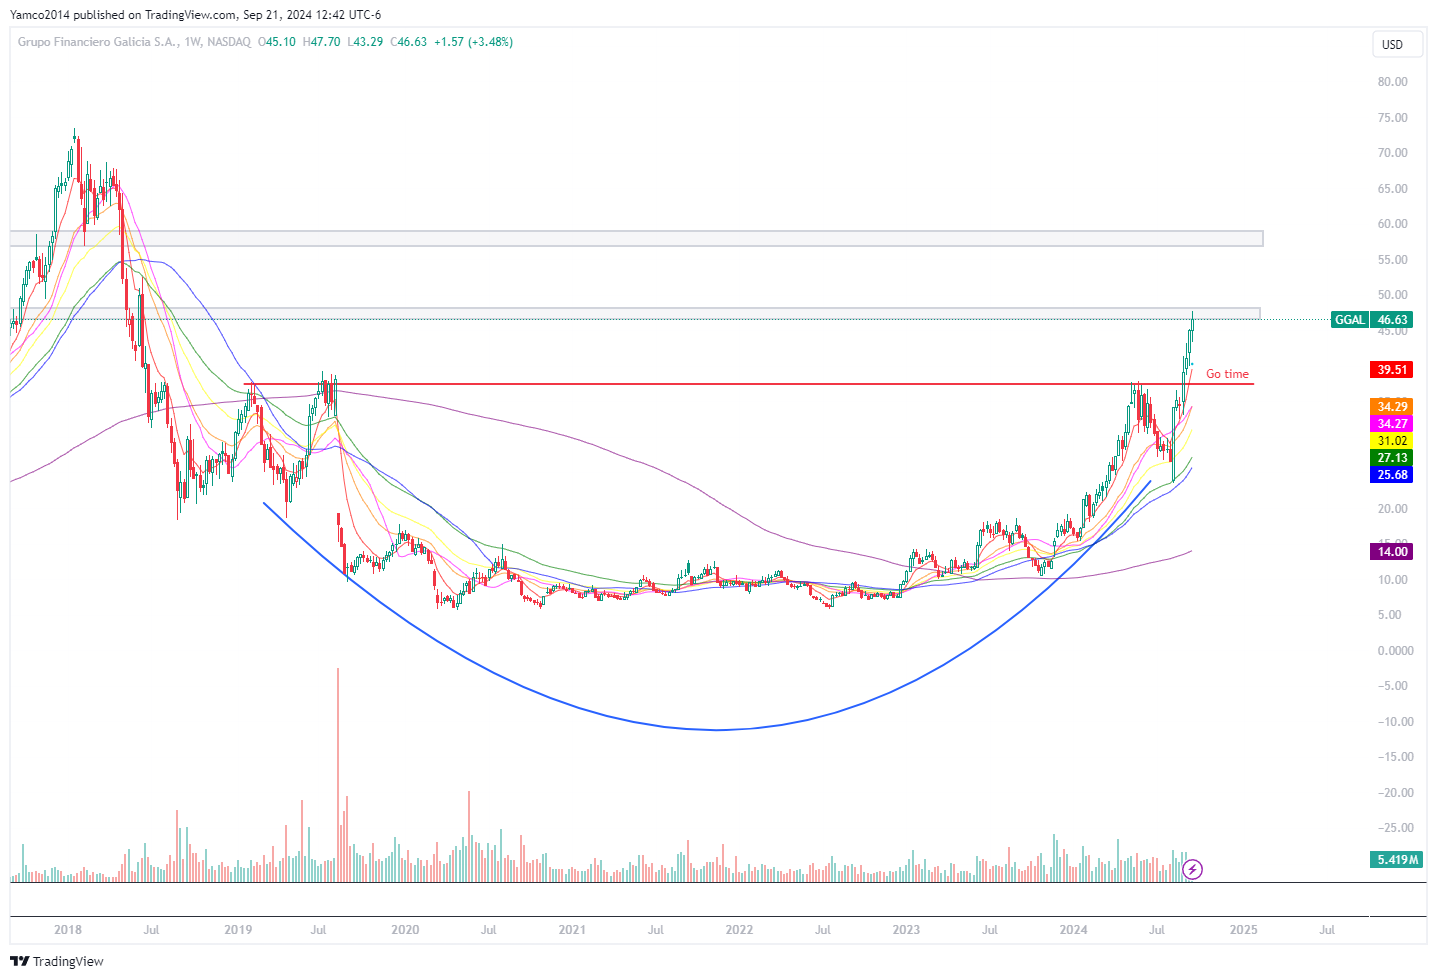
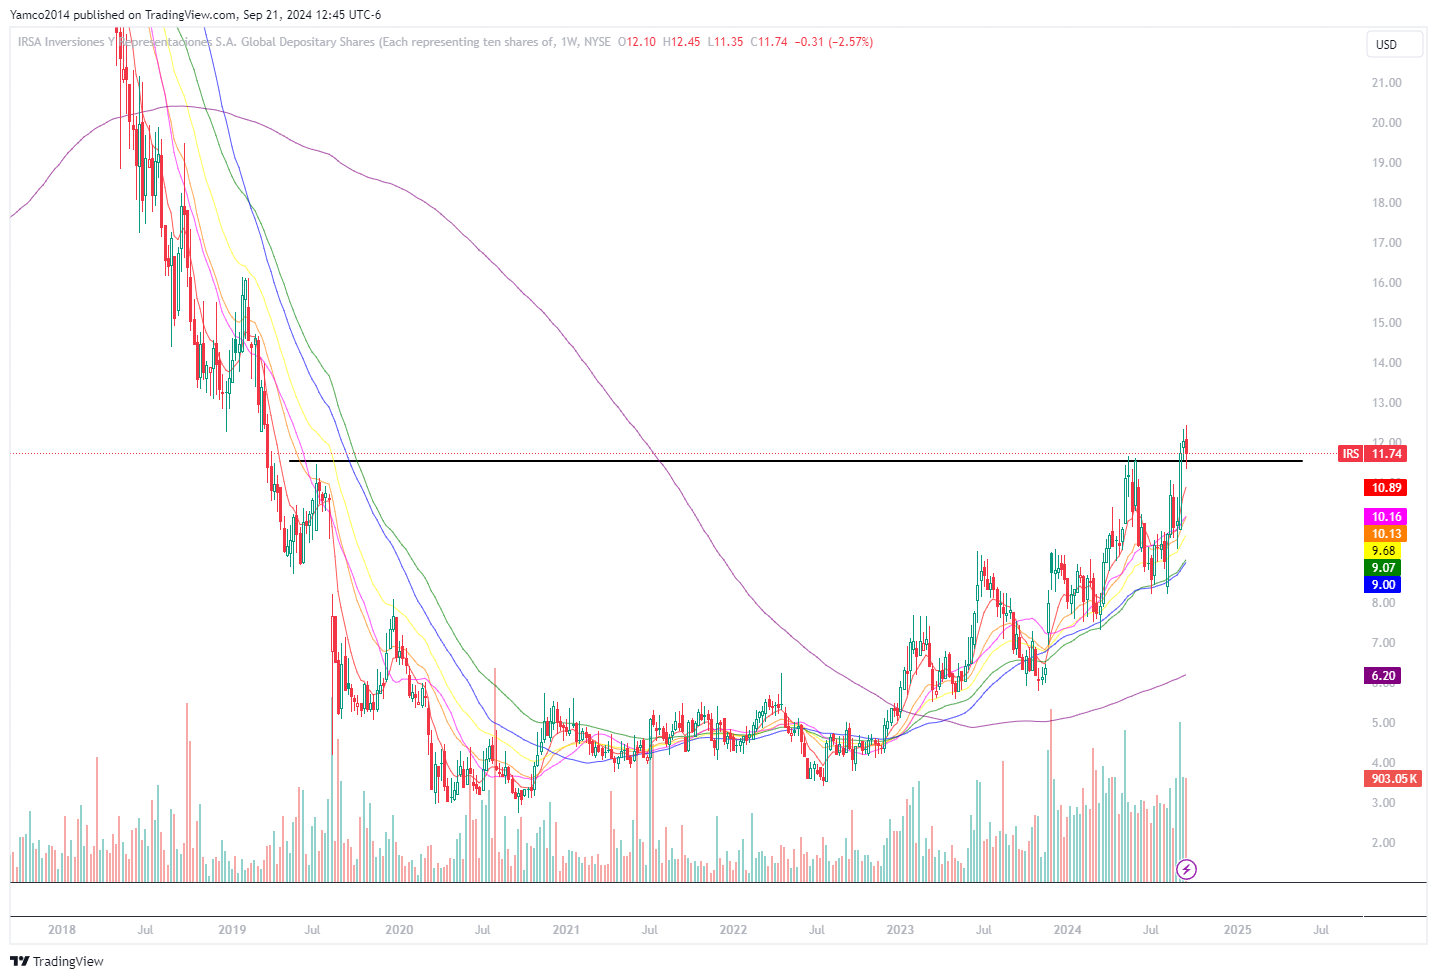
Since February 2019, this area around 37.5 has served as a multi-year resistance. in late August 2024, GGAL 0.00%↑ broke this resistance and is now up 26% in < 1 month. Not shabby. Similar stories here in EDN 0.00%↑ , LOMA 0.00%↑ , and IRS 0.00%↑
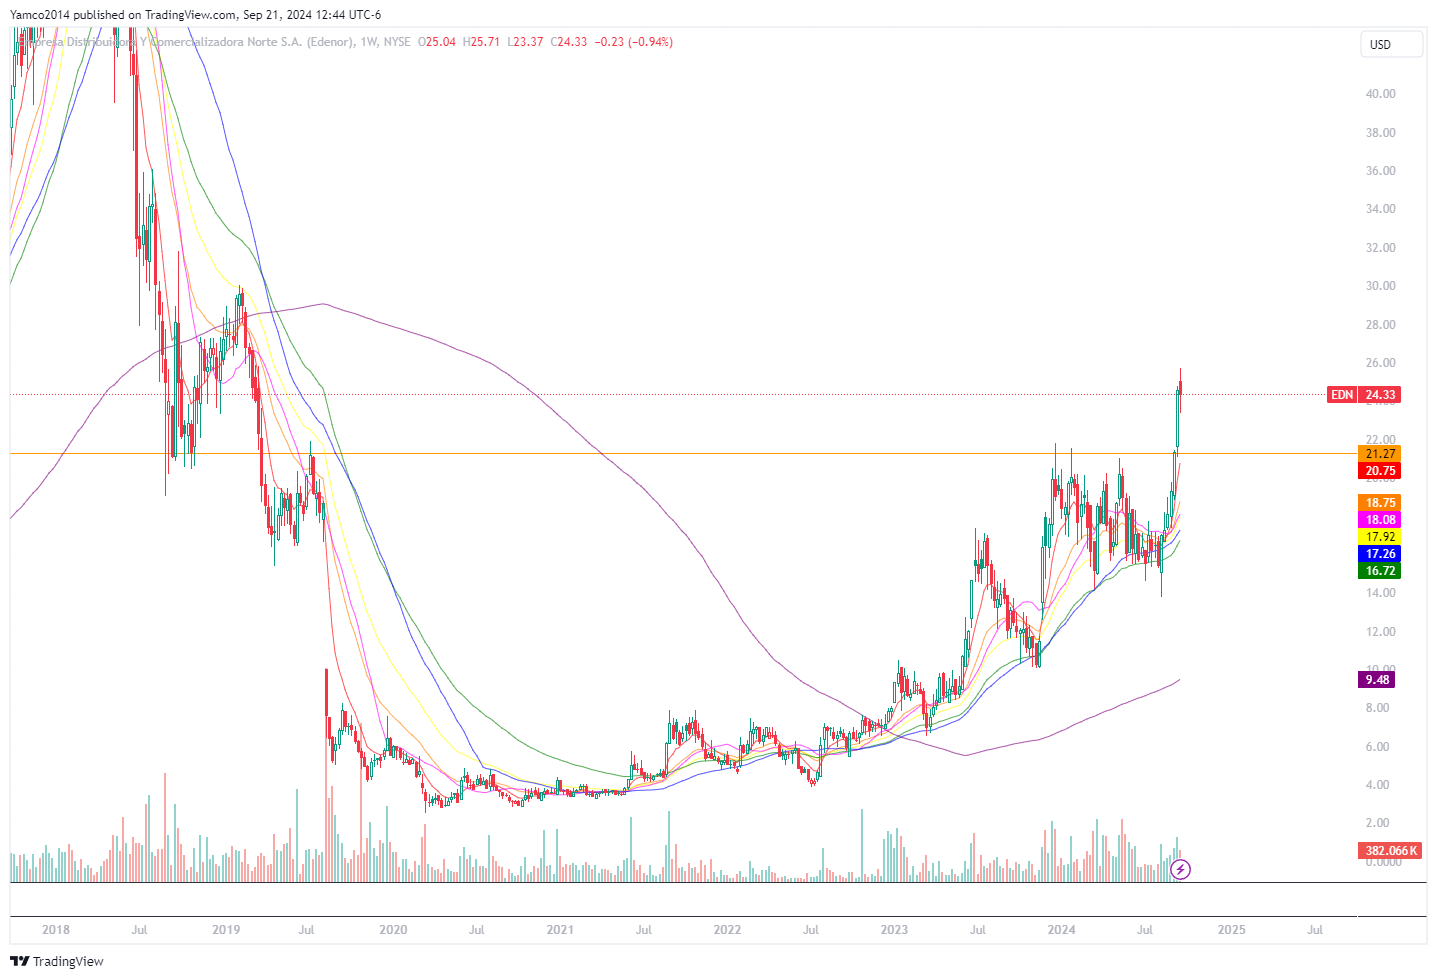
EDN 0.00%↑ - up ~16% after breaking over this resistance in 2 weeks

LOMA 0.00%↑ - up 10% in 1 week
EDN 0.00%↑ - Might be a false breakout but time will tell.
Supply and resistance zones
No resistance: When a stock breaks an all-time high or all-time low, there are no historical price levels above the current price where previous sellers may be waiting to take profits (resistance) or close their shorts (support). This can allow the stock to rise more freely since there are no natural price ceilings. When there isn’t historic price, one can use Fibonacci extensions such as this trade I identified but failed to trade - ALL 0.00%↑. For what it’s worth, I identified the trade in a small discord I run here on July 20th with stated targets of a .382 or .618 extension.
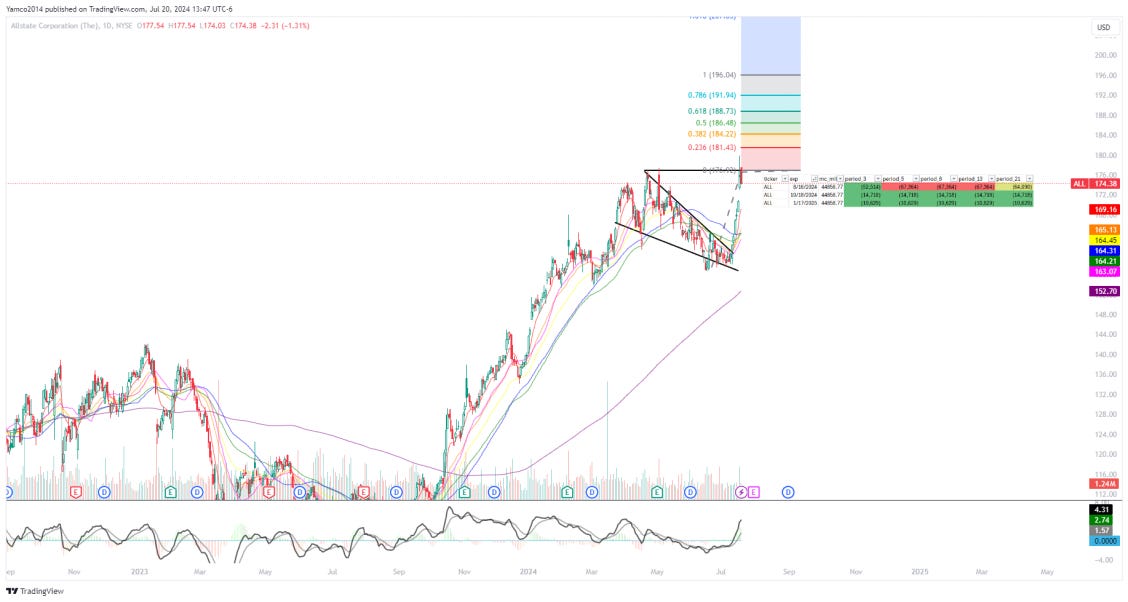
Well… 2 months later the stock is at 191 from 174 ~ not bad.
Positive Sentiment and News
Market psychology: When stocks reach both new highs and new lows, they can often attract more attention (from those trying to short the top, buy the momentum, buy the bottom, or short the bottom. Buying a breakout can be seen as a sign of strength and optimism while selling a breakdown can be seen as a sign of weakness and pessimism… You’re telling me you don’t like to kick someone when they’re down….? (figureatively of course)….. Investors may view this as a confirmation that others are confident about the stock’s future prospects, leading to increased buying pressure on the breakout and increased selling pressure on the breakdown.
There’s this small company called NVDA 0.00%↑ that people are OBSESSED WITH. Apparently they make really good products, have lots of cash, and there’s even rumors (conspiracies…cough…cough) of accounting fraud! It’s like a telenovela on the chart!

I highlighted just a few areas where it broke above previous ATHs and continued to rip! Did I invest in this - I would love to tell you I rode it all the way up, but I scalped 10-25% a few times along the way. That’s my style of trading….
Confirmation of Technical Analysis Pattern
Technical signals: A breakout is often seen as a confirmation of a bullish technical pattern, such as breaking above resistance in a chart pattern (e.g., ascending triangle, cup and handle). Many technical traders buy after breakouts, expecting the stock to continue its upward trajectory as it enters a new trading range.
Keeping with the trend of highlighting great plays I’ve identified and never highlighting losers, here’s MNDY 0.00%↑ from May 2024. Looked like a weekly C&H (cup and handle), had some very bullish flows, so I alerted a few friends to upside potential here…
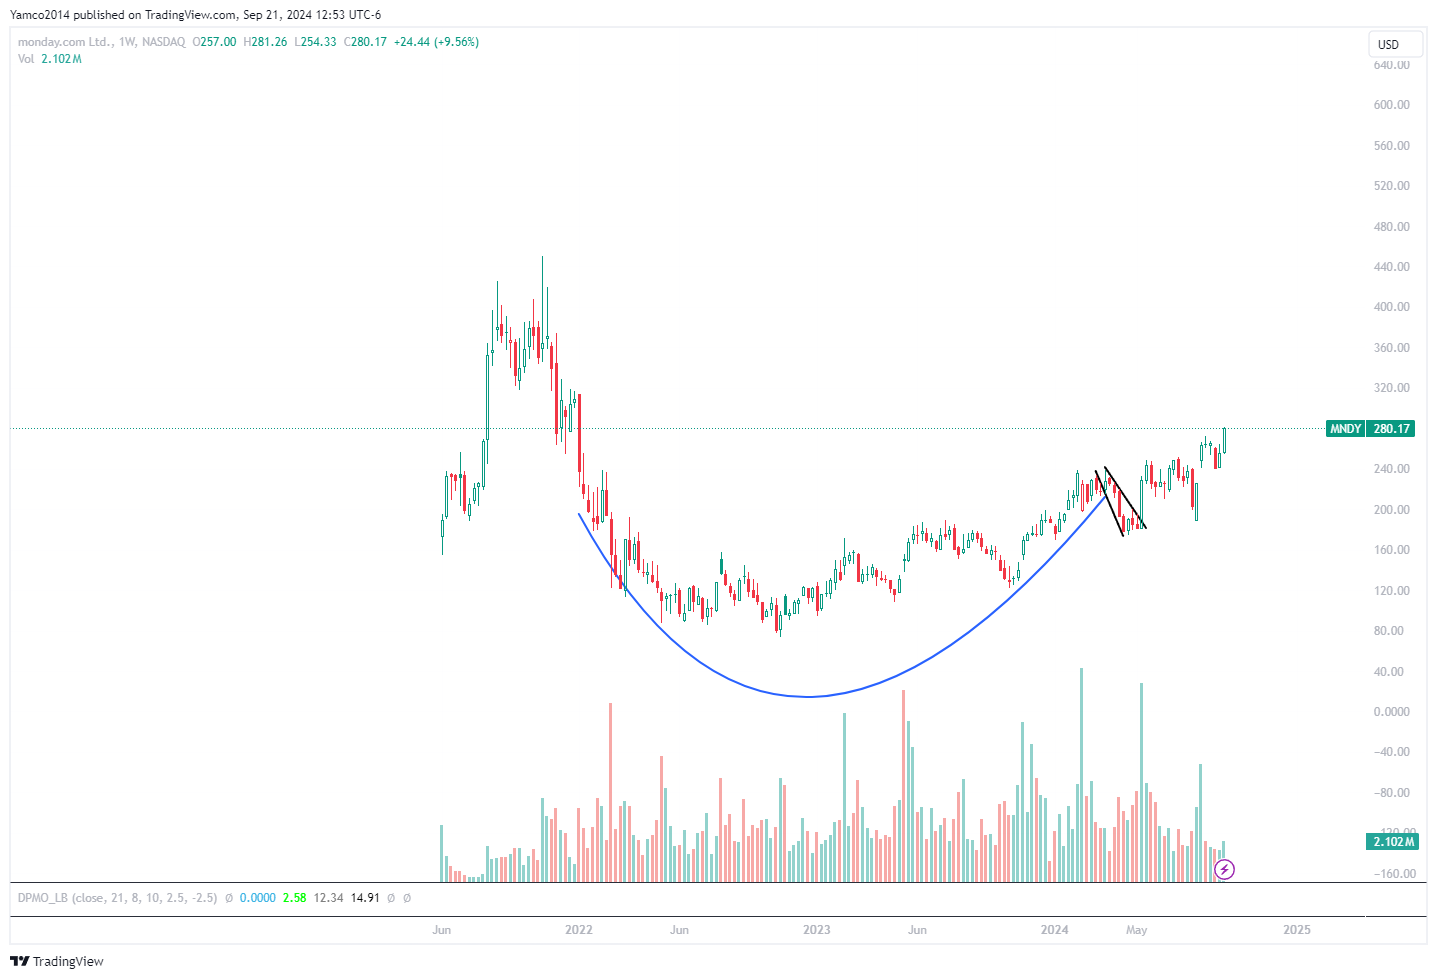
The stock ended up gapping up 20+% and continued up to 35% gain in subsequent days.
Volume confirmation: A breakout to a new high or a breakdown to new lows on increasing volume is a strong technical signal. This suggests that the breakout is supported by a large number of market participants, which is a sign of potential continuation.
End of consolidation or downtrend: When a stock breaks out of a trend, especially if it’s breaking through long-term resistance or overcoming a prolonged period of consolidation or sideways movement, it can signal a potential reversal from a neutral or bearish phase to a bullish one.

Since this is fresh and I’m still salty about selling this way too early… here’s VST 0.00%↑. It broke out of a daily down trend on 9-13 (bought basically at the start of the day) and I sold it by the 17th thinking I was a savant since I just made 12% in 3 days. Since then, the stock is up 17% more and I feel dumb. Such is life - time to find the next breakout, buy, and sell too early.
Institutional Interest
Institutional buying: Large investors - think hedge funds or family offices often buy stocks and retail investors typically pile in to the same trade when it’s reported (the quarterly 13-F releases (filed 6 weeks after quarter end)). The most recent trade I can remember is China around the middle of April. from April 19 2024 to May 22 2024, HSI (the Hang Seng Index) rallied > 20% and subsequently sold off. Was this due to institutional buying… no idea, but it sure did start rallying after the latest 13F came out….

Breakout or Retest of Important Technical Levels
Key technical levels: Many investors look at a variety of lines on a chart, think they’re Rain Man and plot to take over the world (any Pinky and the Brain watchers??). These can be Fibonacci levels (retracements or extensions), previous ATHs (breakout or bounce), previous ATLs (dumpster diving anyone?), or a variety of imaginary trend lines - see HSI above or VST.
Here’s an example of retesting of important technical levels with RCL 0.00%↑ in February 2024.

Simply put, it came down to retest the July 2023 ATH and immediately bounced. I made 10% shortly afterward and moved on.
Good content today, thanks!
Thanks for sharing! How can I join your discord server?