
Mid-Week Update [03/19]
Fear and Degrossing

Nothing captures the sentiment shift around Iran and Hormuz better than this polymarket graph
80% chance of normalcy ~10 days ago to now it’s so over
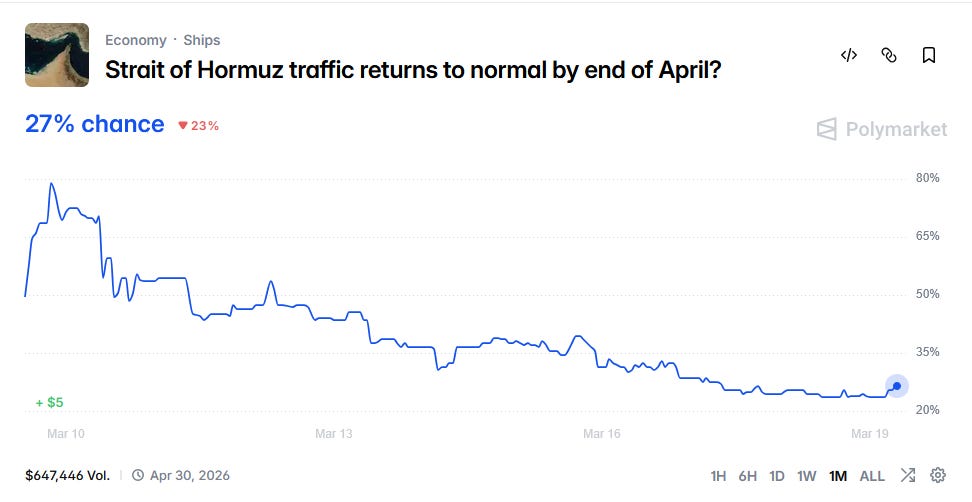
Source: Hormuz; Polymarket
Let’s take a look at sentiment and broad equity exposure levels to gauge market positioning
AAII survey
Peak fear since Liberation day; This is generally a “fun” survey to monitor for me as anyone can answer it so it’s alot of retail investors who click It’s so over vs It’s so back every other day.
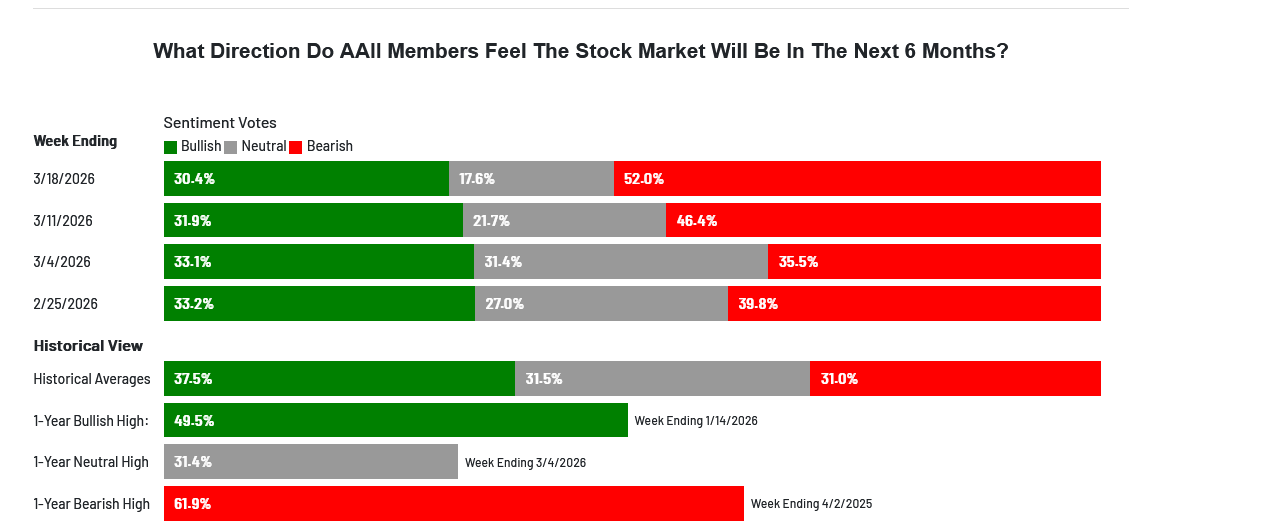
Source:AAI Survey
NAAIM - Institutional Positioning
The NAAIM Exposure Index represents the average exposure to US Equity markets reported by our members.
Just take a look at how poor positioning is - These funds have mandates around losses and are forced to degross.
The energy crisis is front and center and ultimately Energy is at the forefront of inflationary spikes - mind you I’m not really a macro guy and trade data over macro.
To capture inflationary expectations and Future cuts, we can look at two things…
1st - 2 year to Interest Rate on Reserve Balances
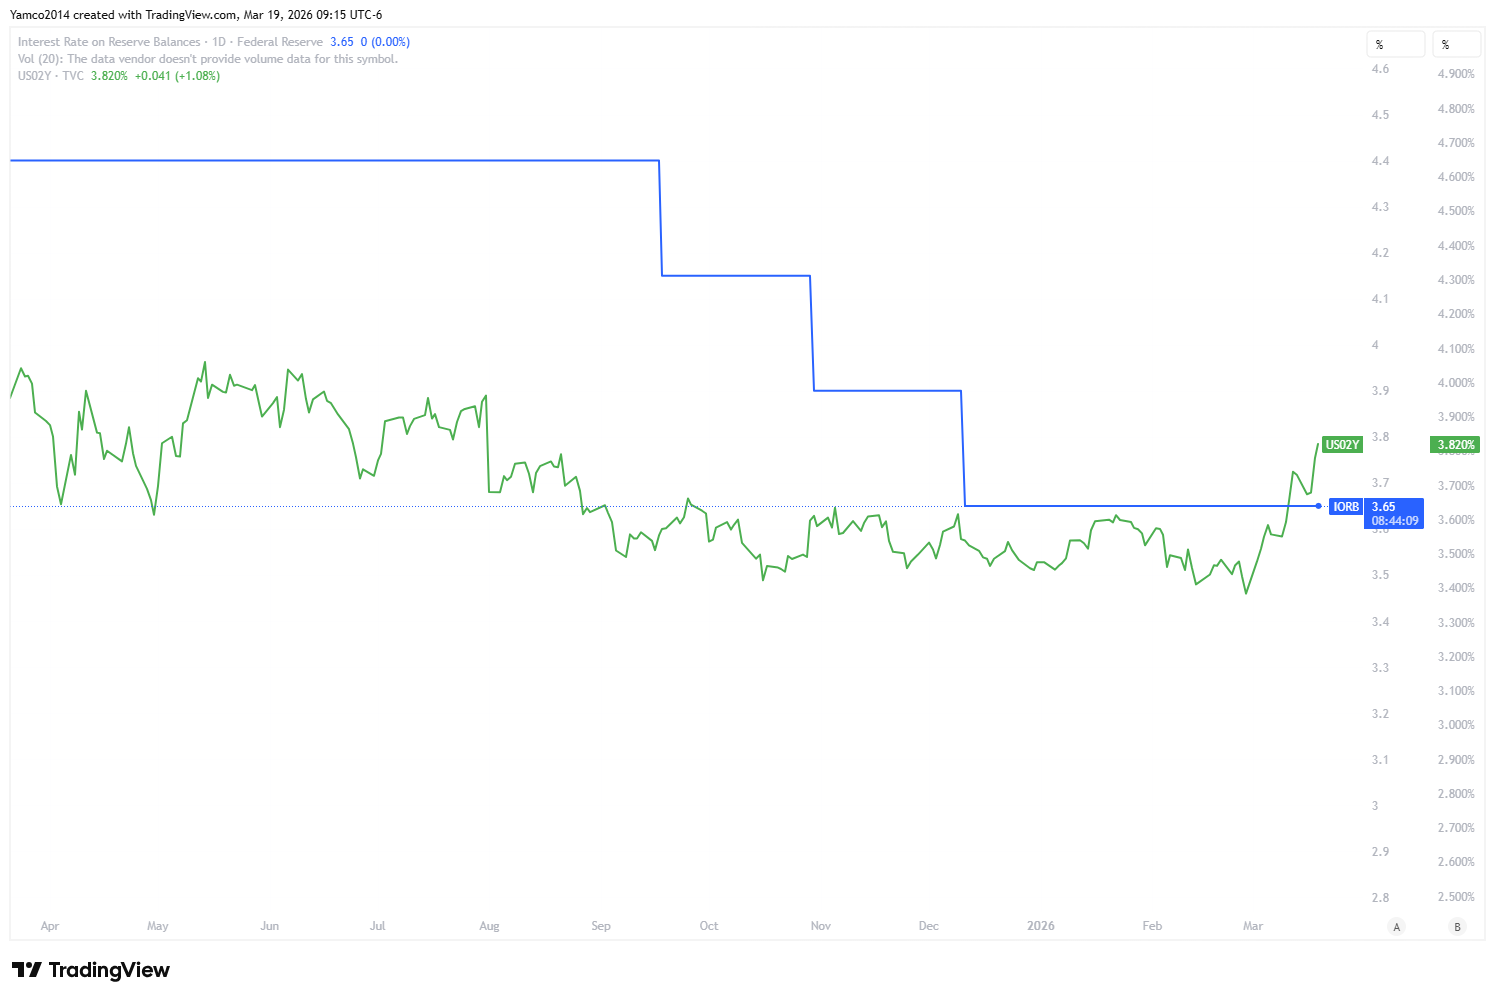
I’ve tried my best to scale it - bottom line….. US 2 Year > IORB means cuts are being prices out
Or we can simple look at SOFR forecasts compared to three months ago.
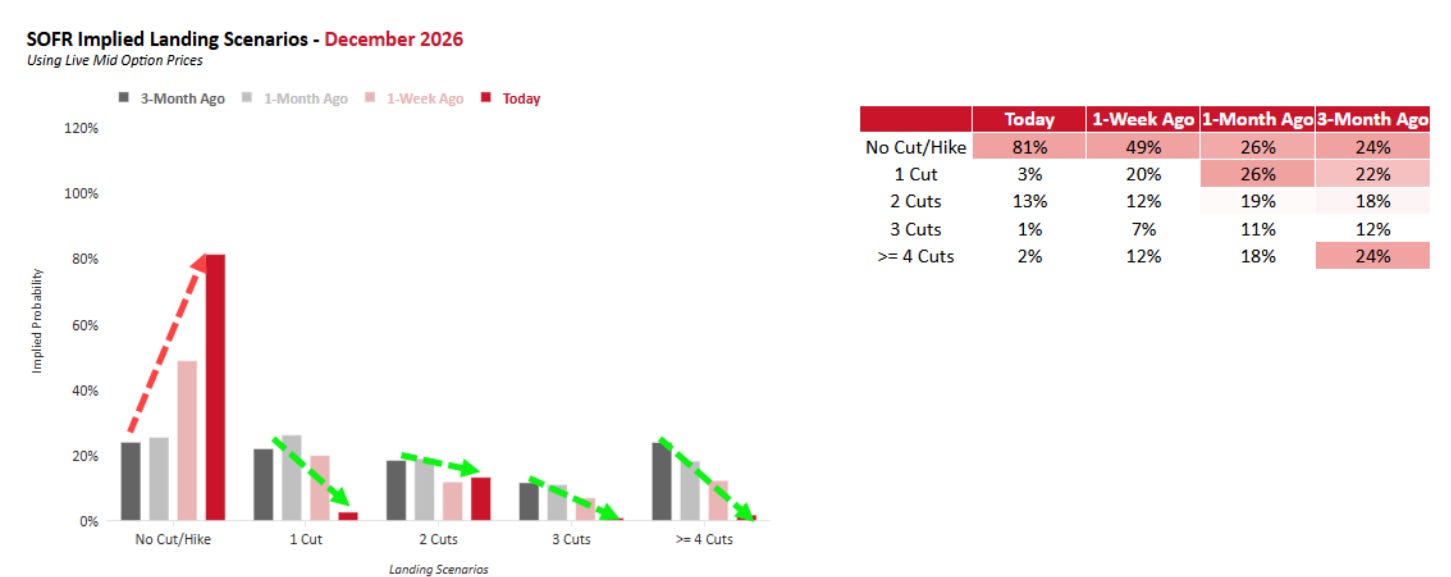
Source: Nomura
Before we dive into some Positioning, this note from Nomura shows the fragility of the situation
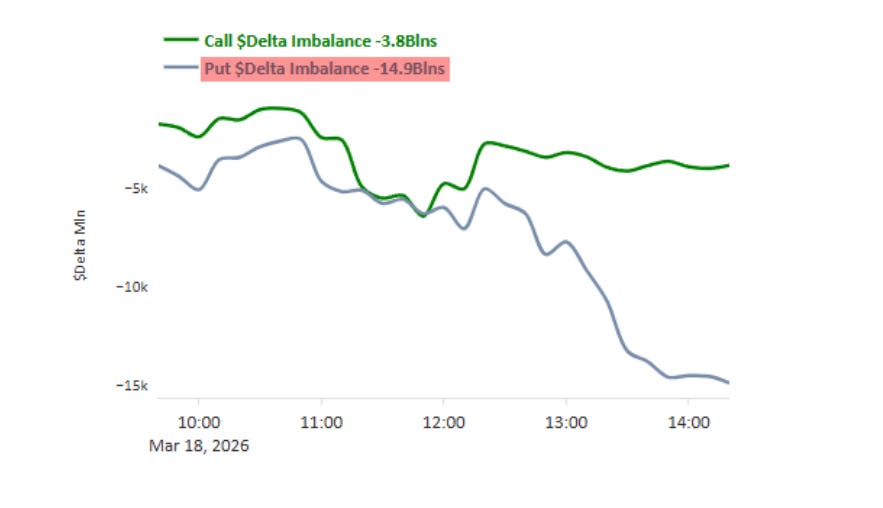
Source: Nomura
First time fresh put buying his the tape in the past 7-10 days. Skew is steepening again.
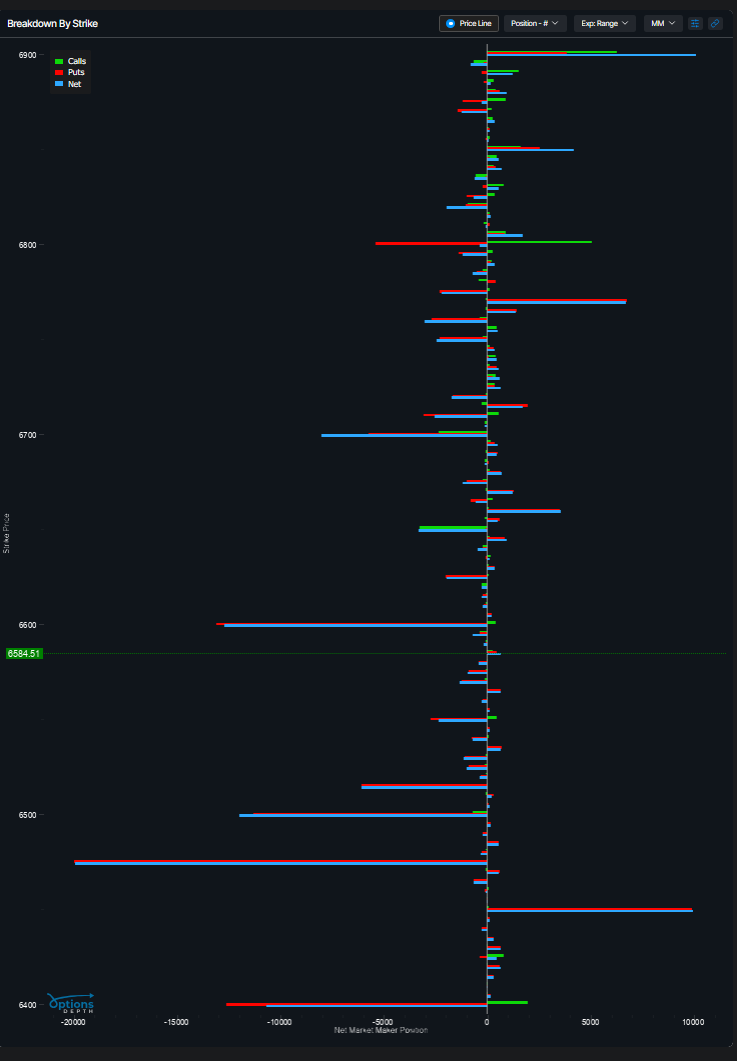
Positioning ($SPX)
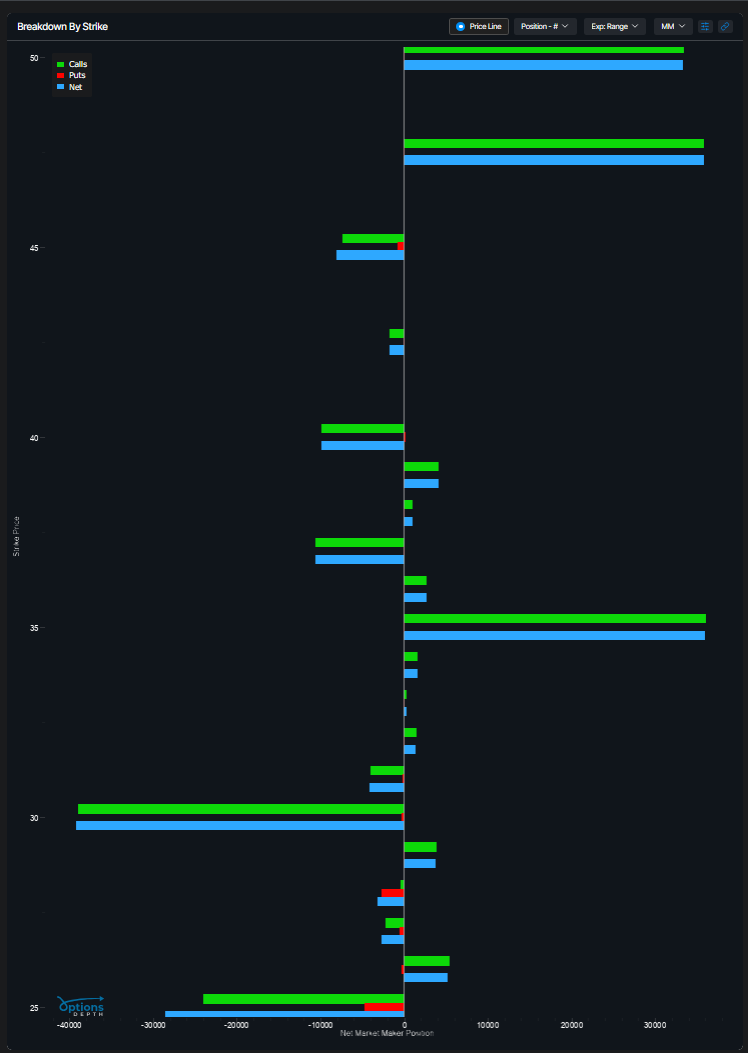
Data from Options Depth
The graph below is consolidating positioning for 23-27 March
What do you notice? Upside doesn’t really exist…
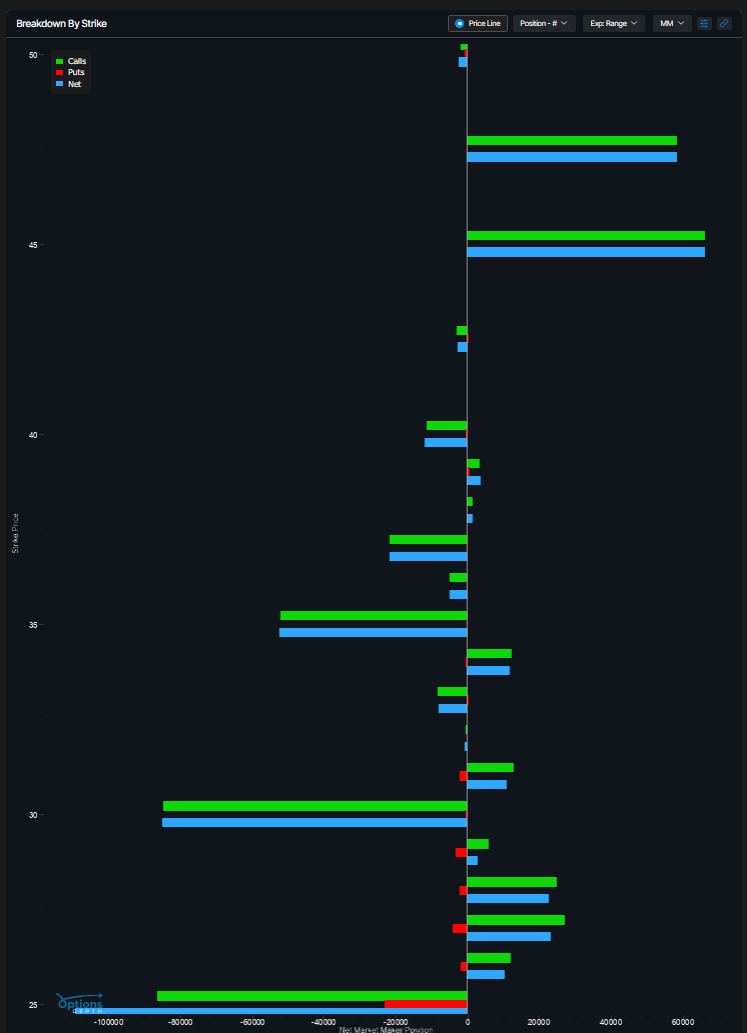
30 March to 17 April
Yeah…. no upside yet…..
We can simply look at a sequence of anchored VWAPs to see the amount of overhead supply that’s above spot
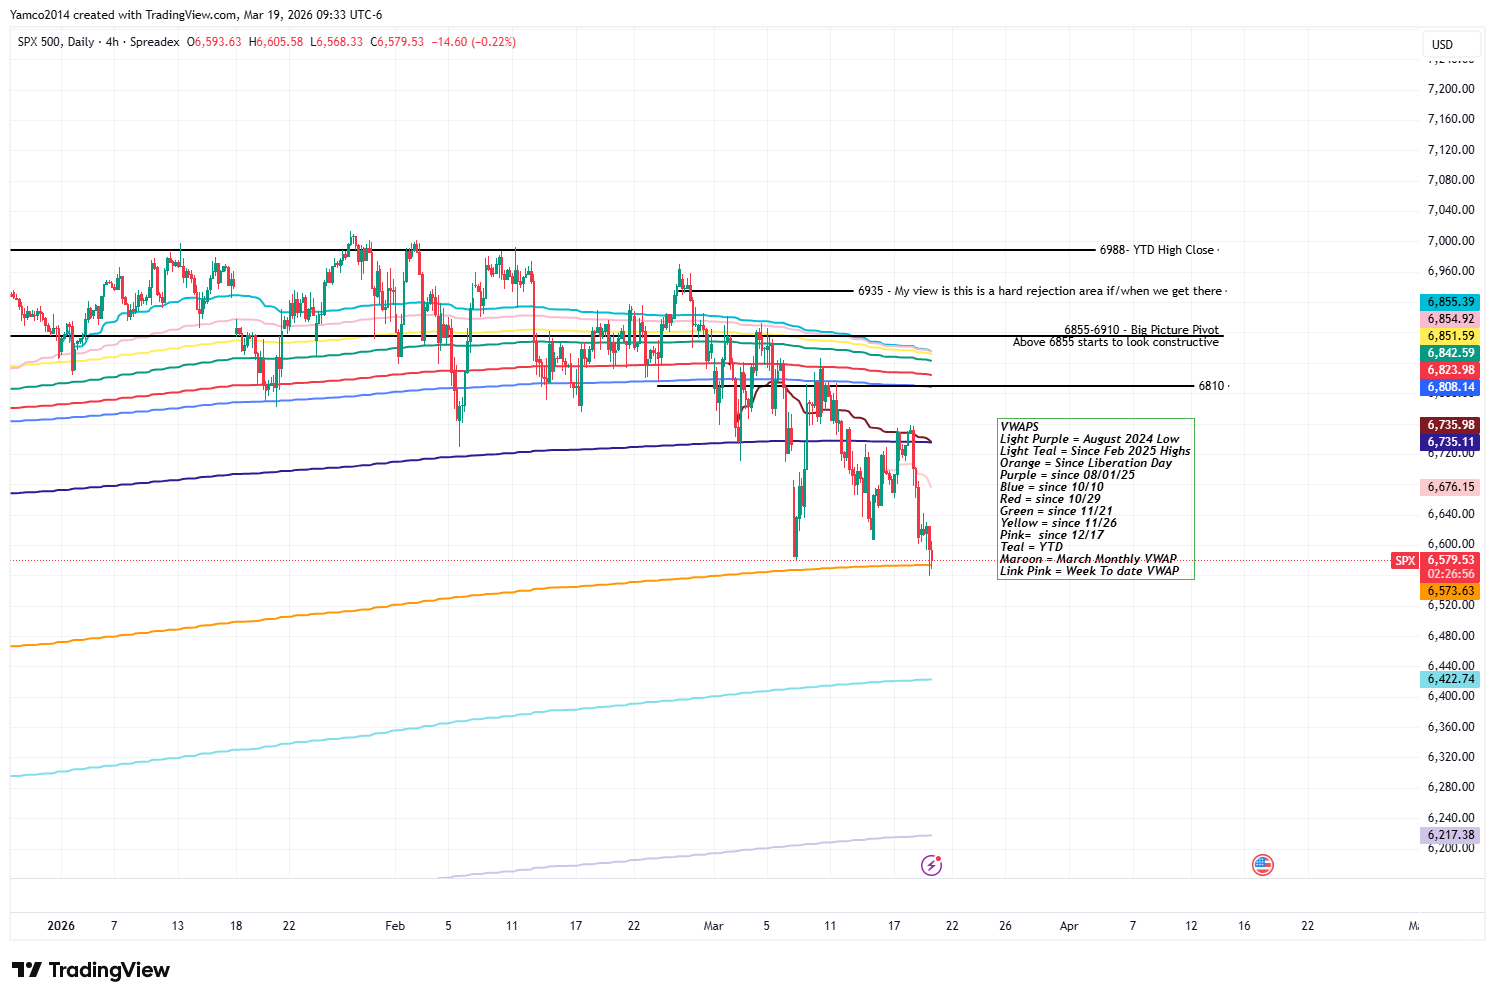
VWAPS
Light Purple = August 2024 Low
Light Teal = Since Feb 2025 Highs
Orange = Since Liberation Day
Purple = since 08/01/25
Blue = since 10/10
Red = since 10/29
Green = since 11/21
Yellow = since 11/26
Pink= since 12/17
Teal = YTD
Maroon = March Monthly VWAP
Link Pink = Week To date VWAP
If you’re a bull, you need to see 6573 confirmed as valid demand - this is the first time it’s been tested since Liberation day. You need energy to settle down and you need rates to cool off. This is a geopolitical issue and ultimately, this is the root of the issues above.
Let’s take a look at volatility positioning
Into April VIXEX
Volatility can expand fluidly upward…. I’m not really showing the downside case.
Post April and into July
Yeah - upside is pretty much net bought
All in all - We’re on the edge of a cliff - we can back away temporarily into this weekend but let’s see what happens around April 1st - Anniversary of Iranian Revolution; could be something…. or could be nothing.
If this was remotely insightful please like/restack - Thanks all!