

Week Ahead Summary
The weekly straddle is 82. We’ve had some great intraday volatility. For now, I generally see the market higher into the summer but earning seasons is coming up - time to see what the hyper scalers say about CAPEX growth (or lack of) and earnings as a result of their aggressive CAPEX cycle.
Realized Volatility is starting to collapse and continues to collapse into 07/20. Historically sharp drops in RV see some bouts of volatility within the next 7 trading days. Let’s see how this goes. If you’ve been around for a while, you know that RV drops normally bring about Vol Control Fund inflows (Systematics that invest on 1m trailing RV) - so the event could be a one day BTD - or something else - let’s see!
Net positioning looks to me like a neutral/choppy move down during the week - call it profit taking into MAGS earnings or whatever you want to I generally don’t expect much index upside into earnings but positioning doesn’t particularly look bearish or bullish for the week - dispersion is likely to increase into earnings (call it the rotating MAG ponzi system). One heavily weighted single name can move the index (or keep it from moving if there’s a bit of profit taking).
ADV line is making new highs while price is stuck; violent rotation going on under the hood as everything AI related dies around CAPEX slowdown fears
Summarizing the above and looking forward, the environment has remained bullish with some violent moves down on headlines. The market is sleeping at the wheel while “internals” look strong - there’s definitely some warning signs which abound ranging from:
COR1M nearing record lows
Dispersion pretty much at record highs
VIXEQ/VIX at record highs
None of the above are necessarily a reason to be bearish - after all, we’ve been in a high dispersion environment for much of the year, correlations are getting lower and lower (look at pre-2022 correlations before 0DTE SPX and look at how it’s shifted down after the April single name 3x a week options came out). Regardless of your view of the market, it’s a mid-term year and there’s quite a bit working against the administration and the admin loves the stock market. Oil is coming down, earnings are great, and economic data has come in fine as a whole.
Topics covered
State of the Market
Next week
Straddles with 50/70 percent ranges
Term Structure
Total Market Structure
Net positioning (Aggregate and by day)
Technical Structure of the Market
Sentiment
Key zones to watch
Charts of Interest
State of the Market
Some short vol shocks occurred this week to find liquidity and get fuel to go higher - I got most of the dip buys (Except Friday - I was too slow).
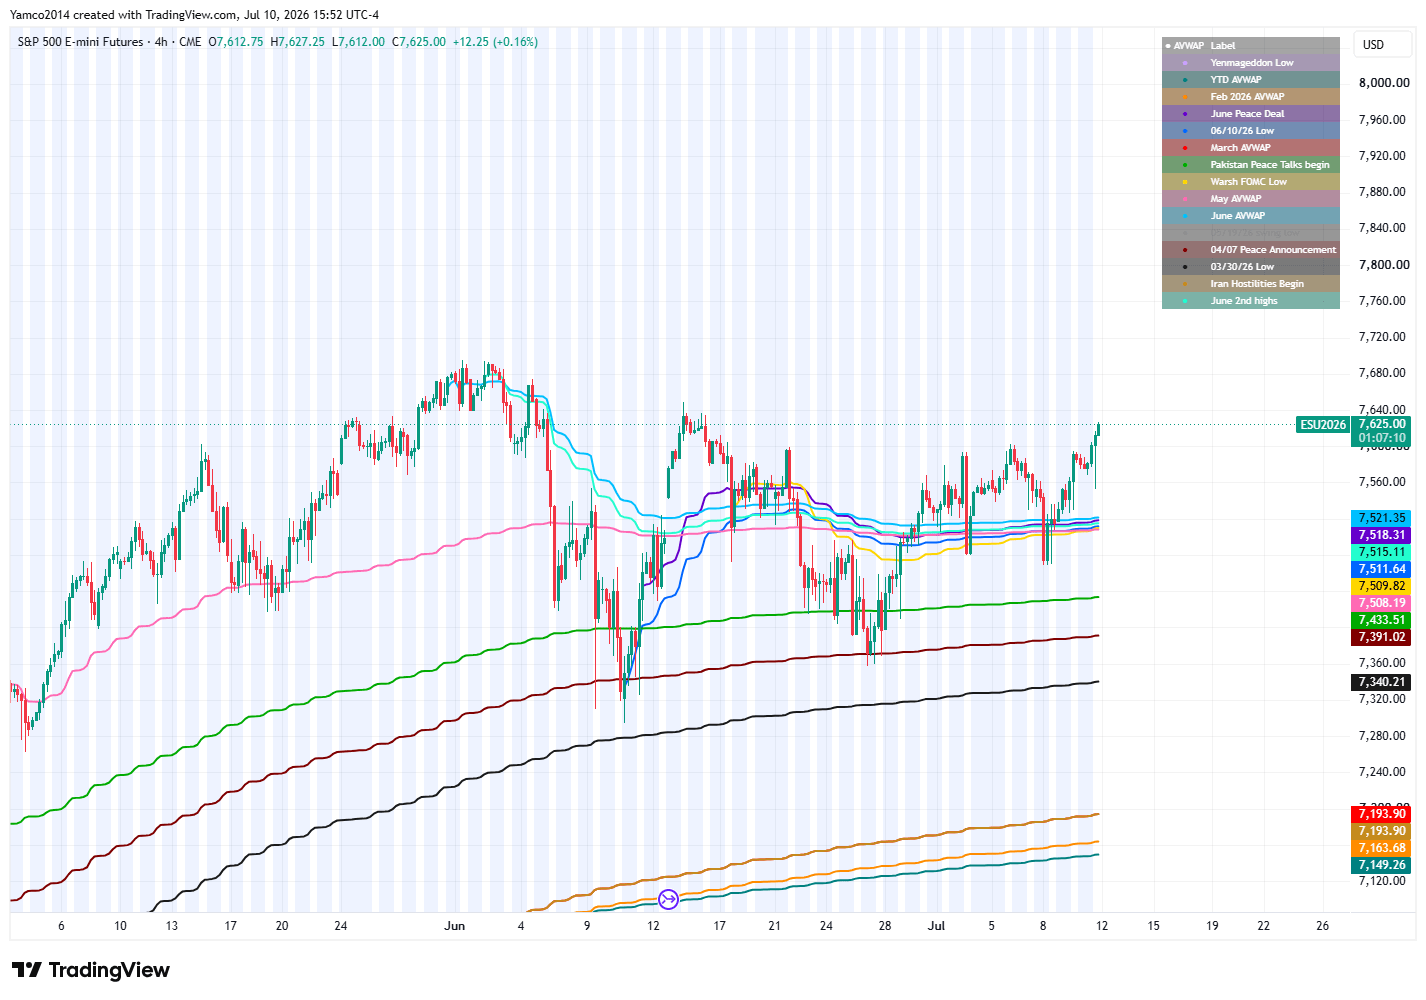
ES VWAPs
NQ VWAPs
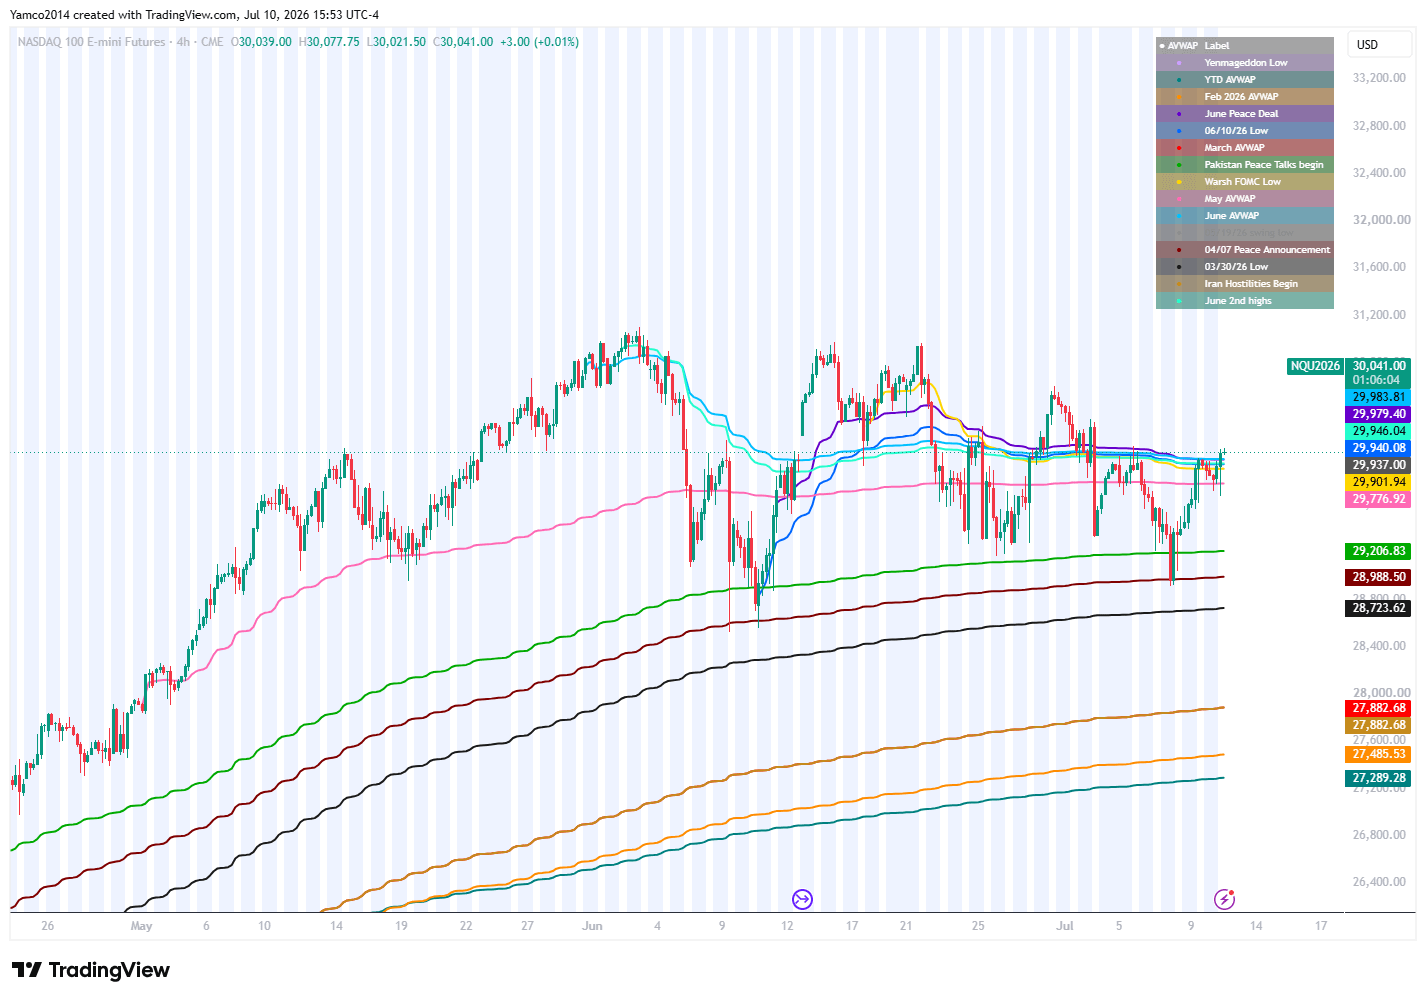
Market looks great across the board now that NQ has finally reclaimed the last upside AVWAPs. However, time will tell if NQ is just an equal high or it going on to make a new high.
Why is this important?
Well….I see AVWAPs as a moving volume profile vs static one and think they’re very useful in looking at price movements.
Indicator Used
I published it on trading view AVWAPs, MAs in one
It takes a bit of setting up but you can do it!
Where are we
The good - Structurally, things look fine and let’s go through them
Holding all AVWAPs
Holding all major moving averages
Working through overhead supply from the early June sell
Think of this candle as the same as 10/10 - It took days to break through to the upside
ADV line at the highs
The bad - Tech is no longer a leader - is the market different this time.
NQ is noticeably weaker than SPX for the first time in a while - the AI factor is resting.
Do I think the buildout is over - nope not one bit. It’s not rocket science but for the market to make a new high, a marginal bid needs to enter big-tech - If Semis stay relatively strong (doesn’t have a massive sell off, and MAGs have a modest bid), it’s enough to push the index higher. Earnings are coming up so we might see the liquidity vortex kick in, RSP bleeds a bit, MAGs catch a bid while semis stay flat - the marginal bid keeps us lifted higher.
Dispersion and you!
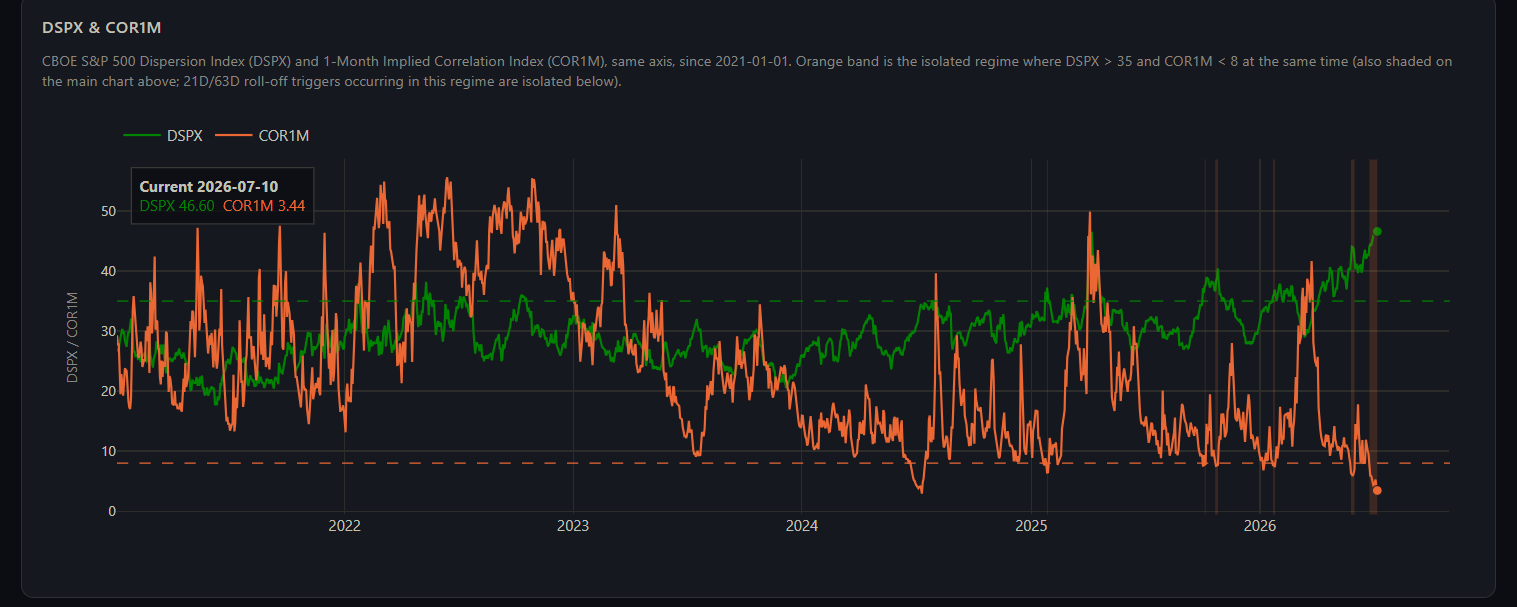
Simple chart showing dispersion (green) and forward 1M correlations - basically the market looks fine at the index level but individual stocks are having massive underlying moves. At the same time, nothing is really moving together (COR1M) - hence the record lows. Is this a bad thing? Not necessarily - it just means a headline can break something but you need the headline to occur.
AI Forward Vol v SPX forward VOL
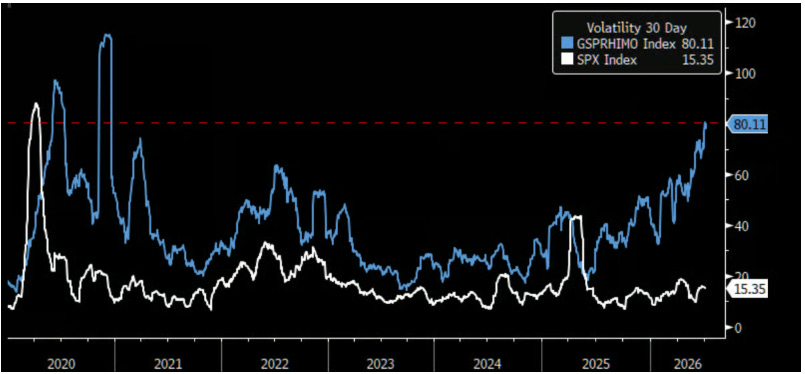
This is a crazy chart to think about the dual environment with SPX and AI forward vol. Market is bidding forward vol on select names and is not worried about any broader moves down in the market. Is this correct? I don’t see any structural issues - the RV event will be a discrete event (if it occurs) and I don’t the underlying narrative to change.
Momentum sell off
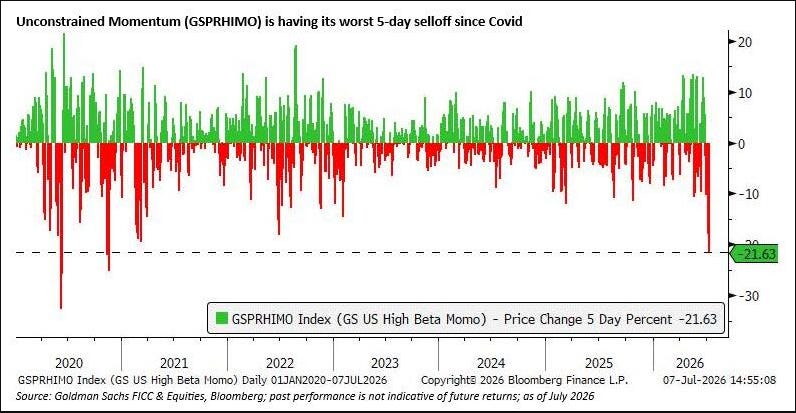
Per Goldman, the sell off over the past week was extreme - the most extreme since COVID. There’s going to be bounces, sell offs, more bounces, selloffs as momentum factor dip buys come in - residual volatility provides an environment for very quick scalps up and down but generally not interested in memory (or photonics) at this time.
VIXEQ (Single name stocks) / VIX (Index)
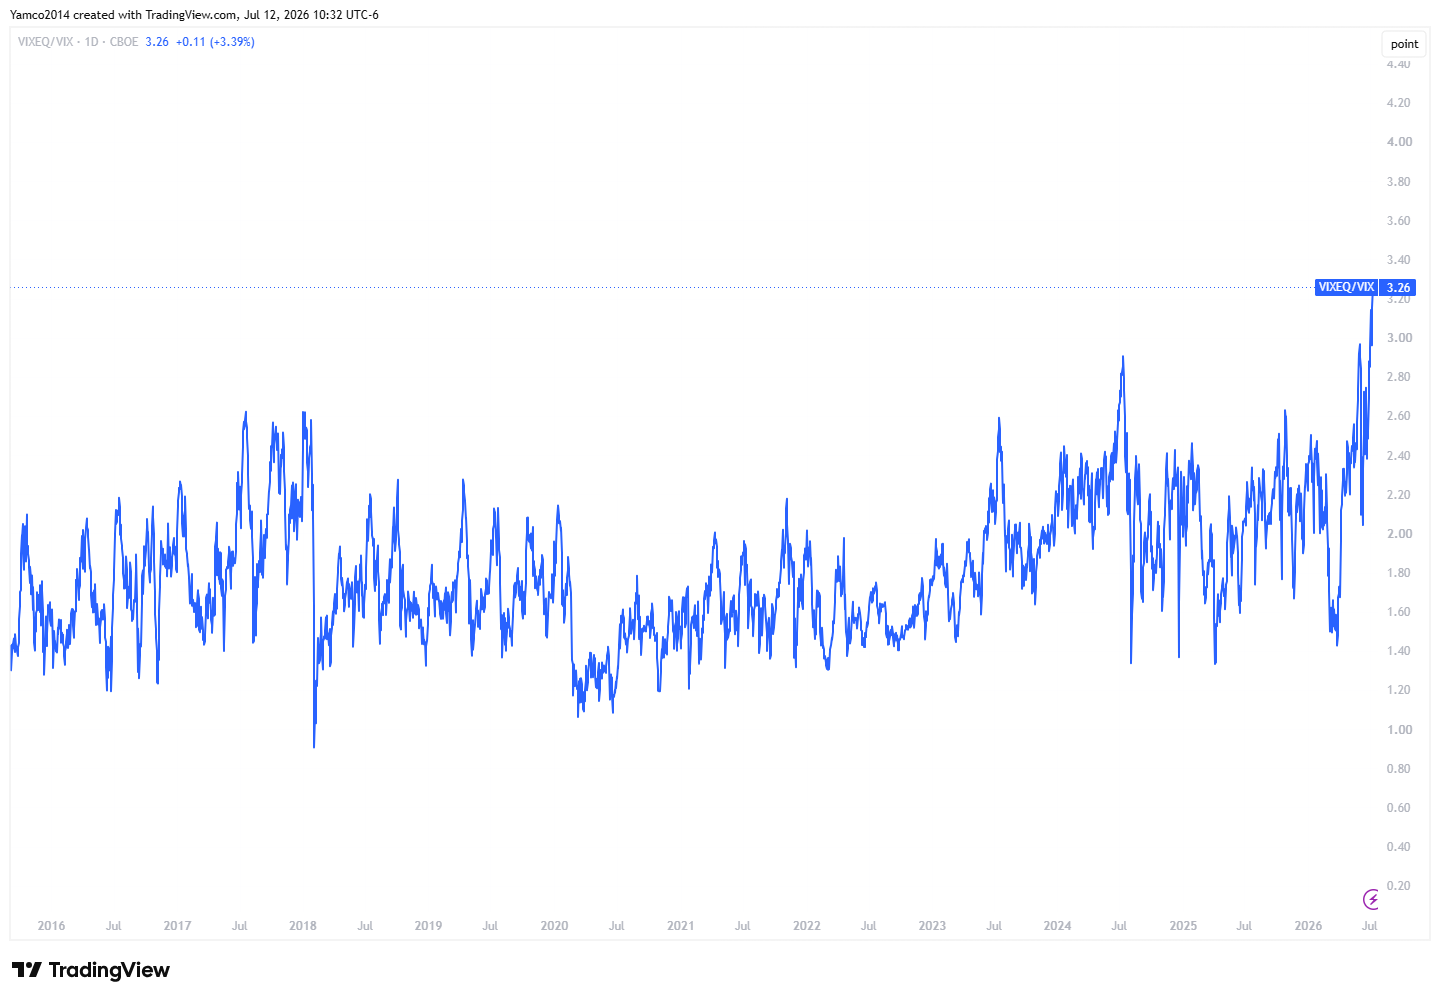
While we’re at it - let’s take a look at VIXEQ/VIX - the ratio of single name 30D volatility v index volatility. It’s at extremes (higher than Volmageddon), higher than COVID - you get the point….
American Exceptionalism and AI
I came across this article from Citadel’s Frank Flight published on July 4th this week and going to highlight some interesting items here.
AI & New Business Applications
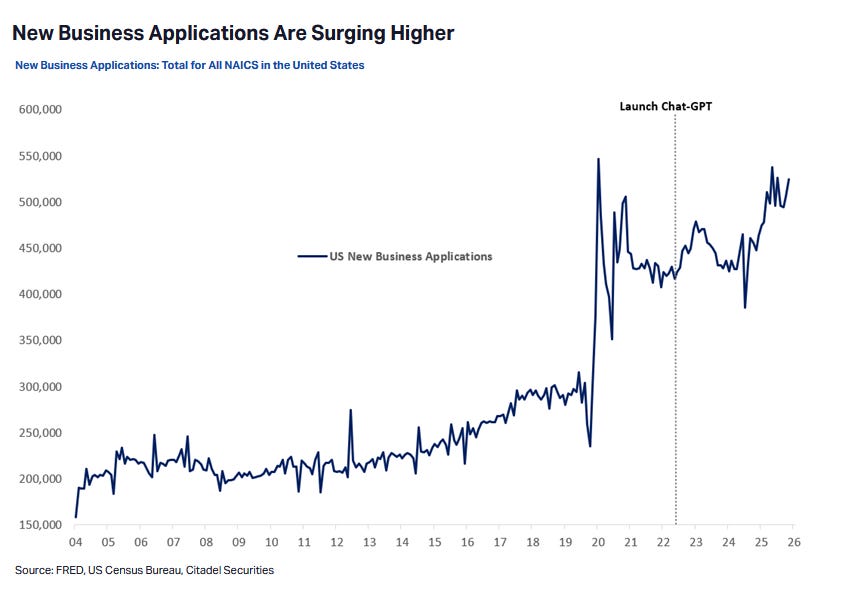
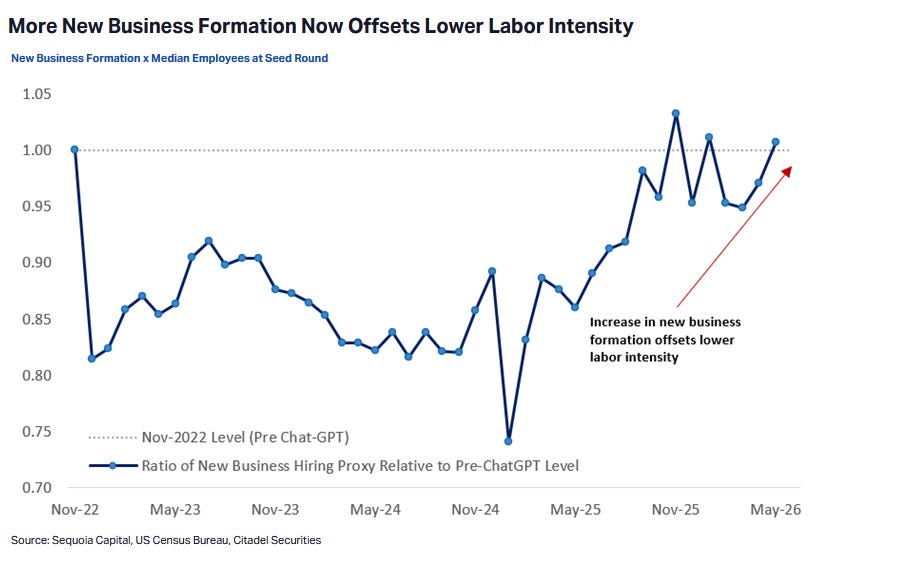
New business applications rocked after ChatGPT came out and showing a noticeable increase over time - maybe AI is lowering the barrier to entry for businesses? Are they successful yet - let’s see but productivity increases are America’s strength.
It’s a simple economics concept - Minimum efficient scale
In economics, minimum efficient scale is the smallest level of output a business can operate at low average cost. AI lowers that threshold by allowing teams to pool resources to accomplish tasks that would normally require a new hire.
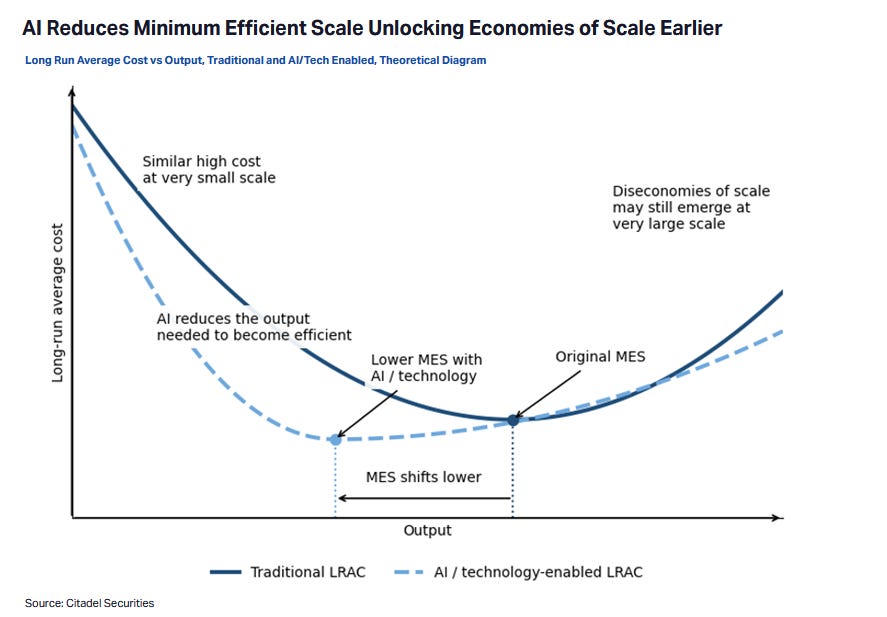
Before you panic over minimum efficient scale saying AI is bearish labor markets, Sequoia estimates that the efficiency of AI (reduction in personnel) is offset by the growth in businesses.
Week ahead
Next week
Straddles with 50/70 percent ranges
Term Structure
VIX Futures
Total Market Structure
Net positioning (Aggregate and by day)
Technical Structure of the Market
Sentiment
Key zones to watch
Economic Calendar
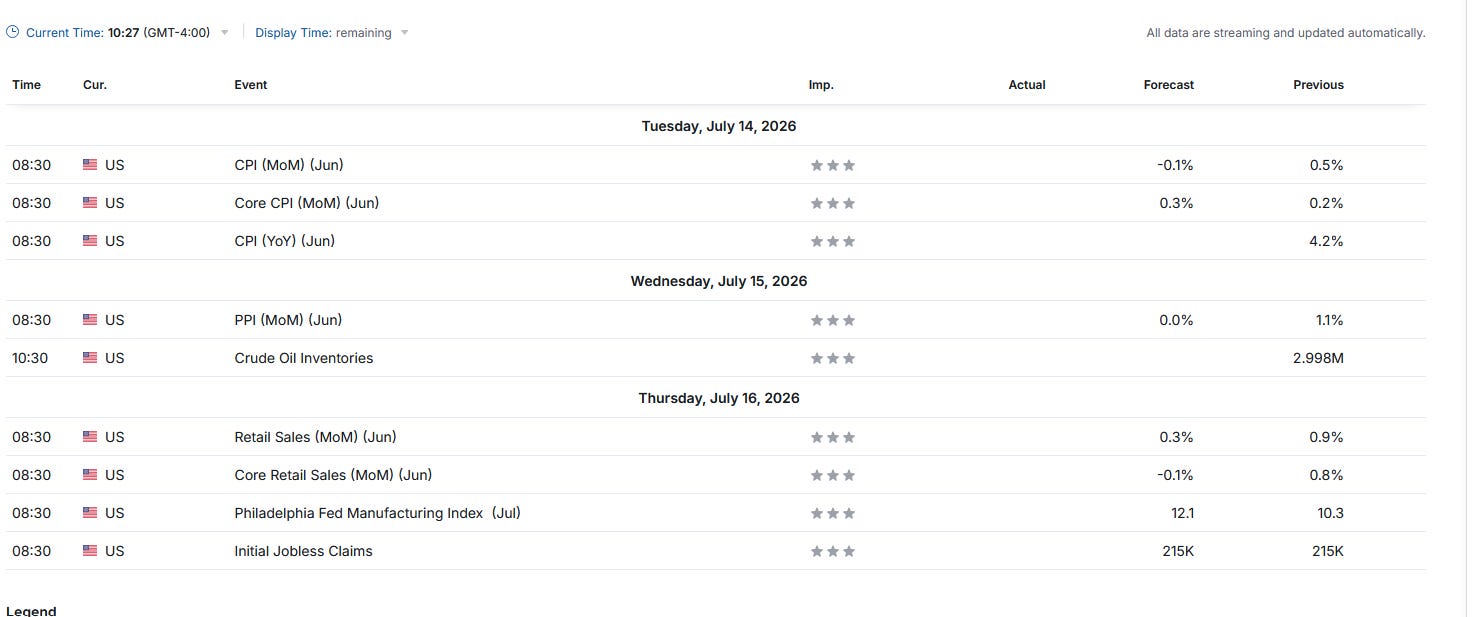
Let’s look at next week’s economic events:
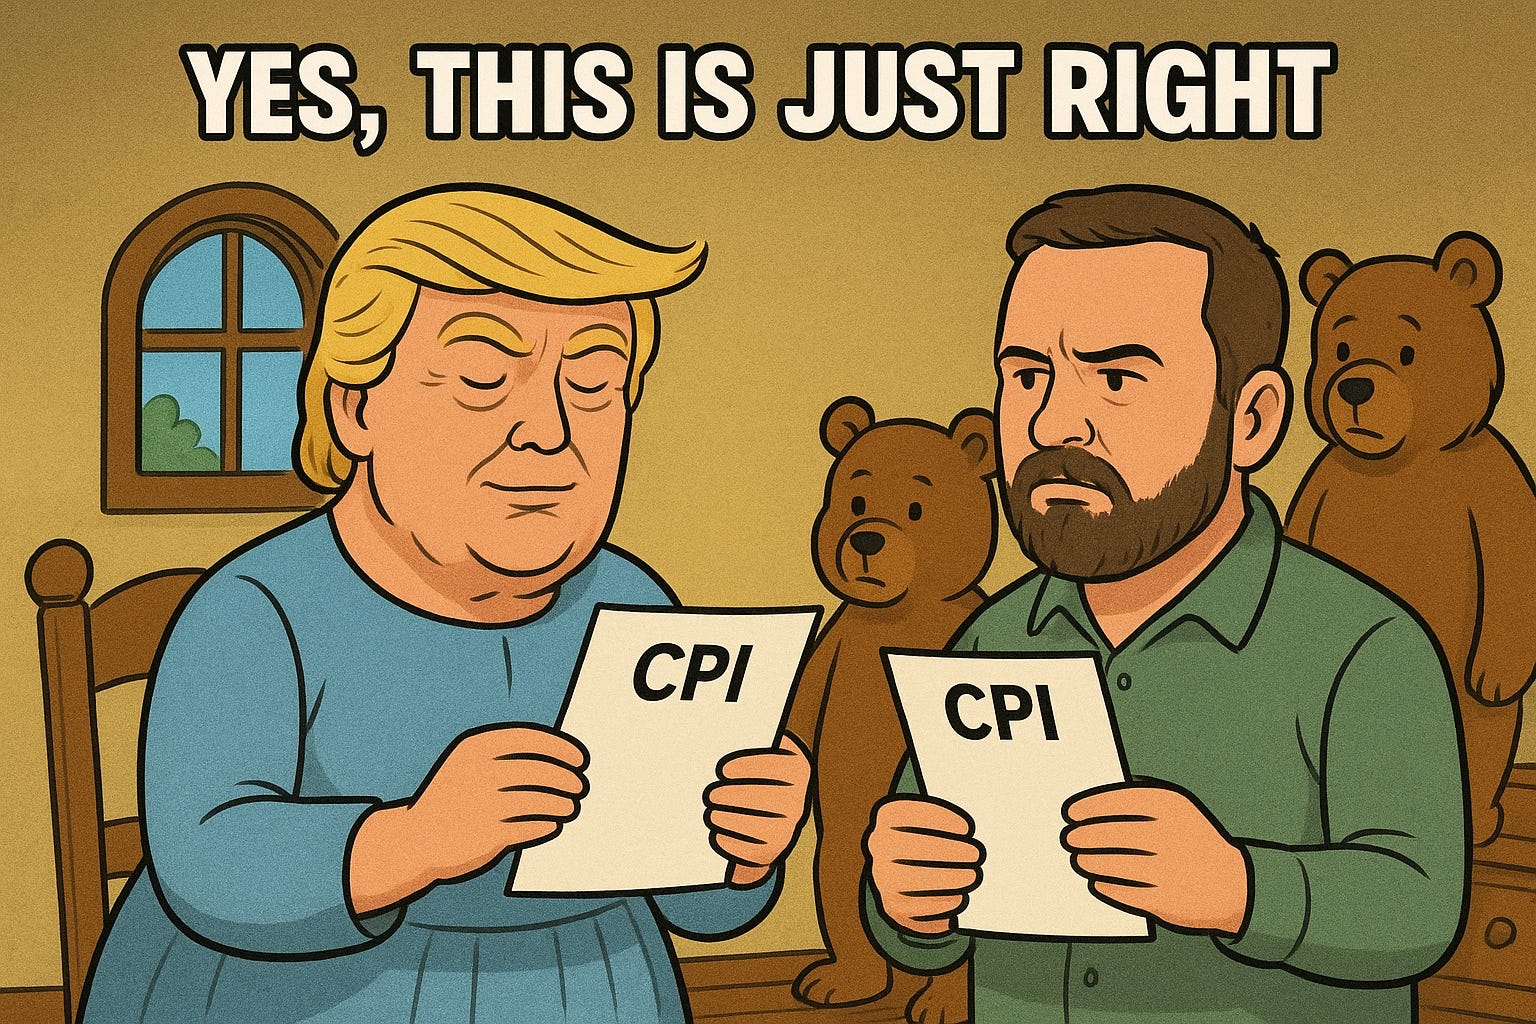
Inflation readings - let’s see how it goes but I expect nothing.

I added some general explanations of my scanner to the Review of Positioning Metrics (Keeping everything in one place)
Straddles with 50/70 percent ranges
Various Time Frame Straddles
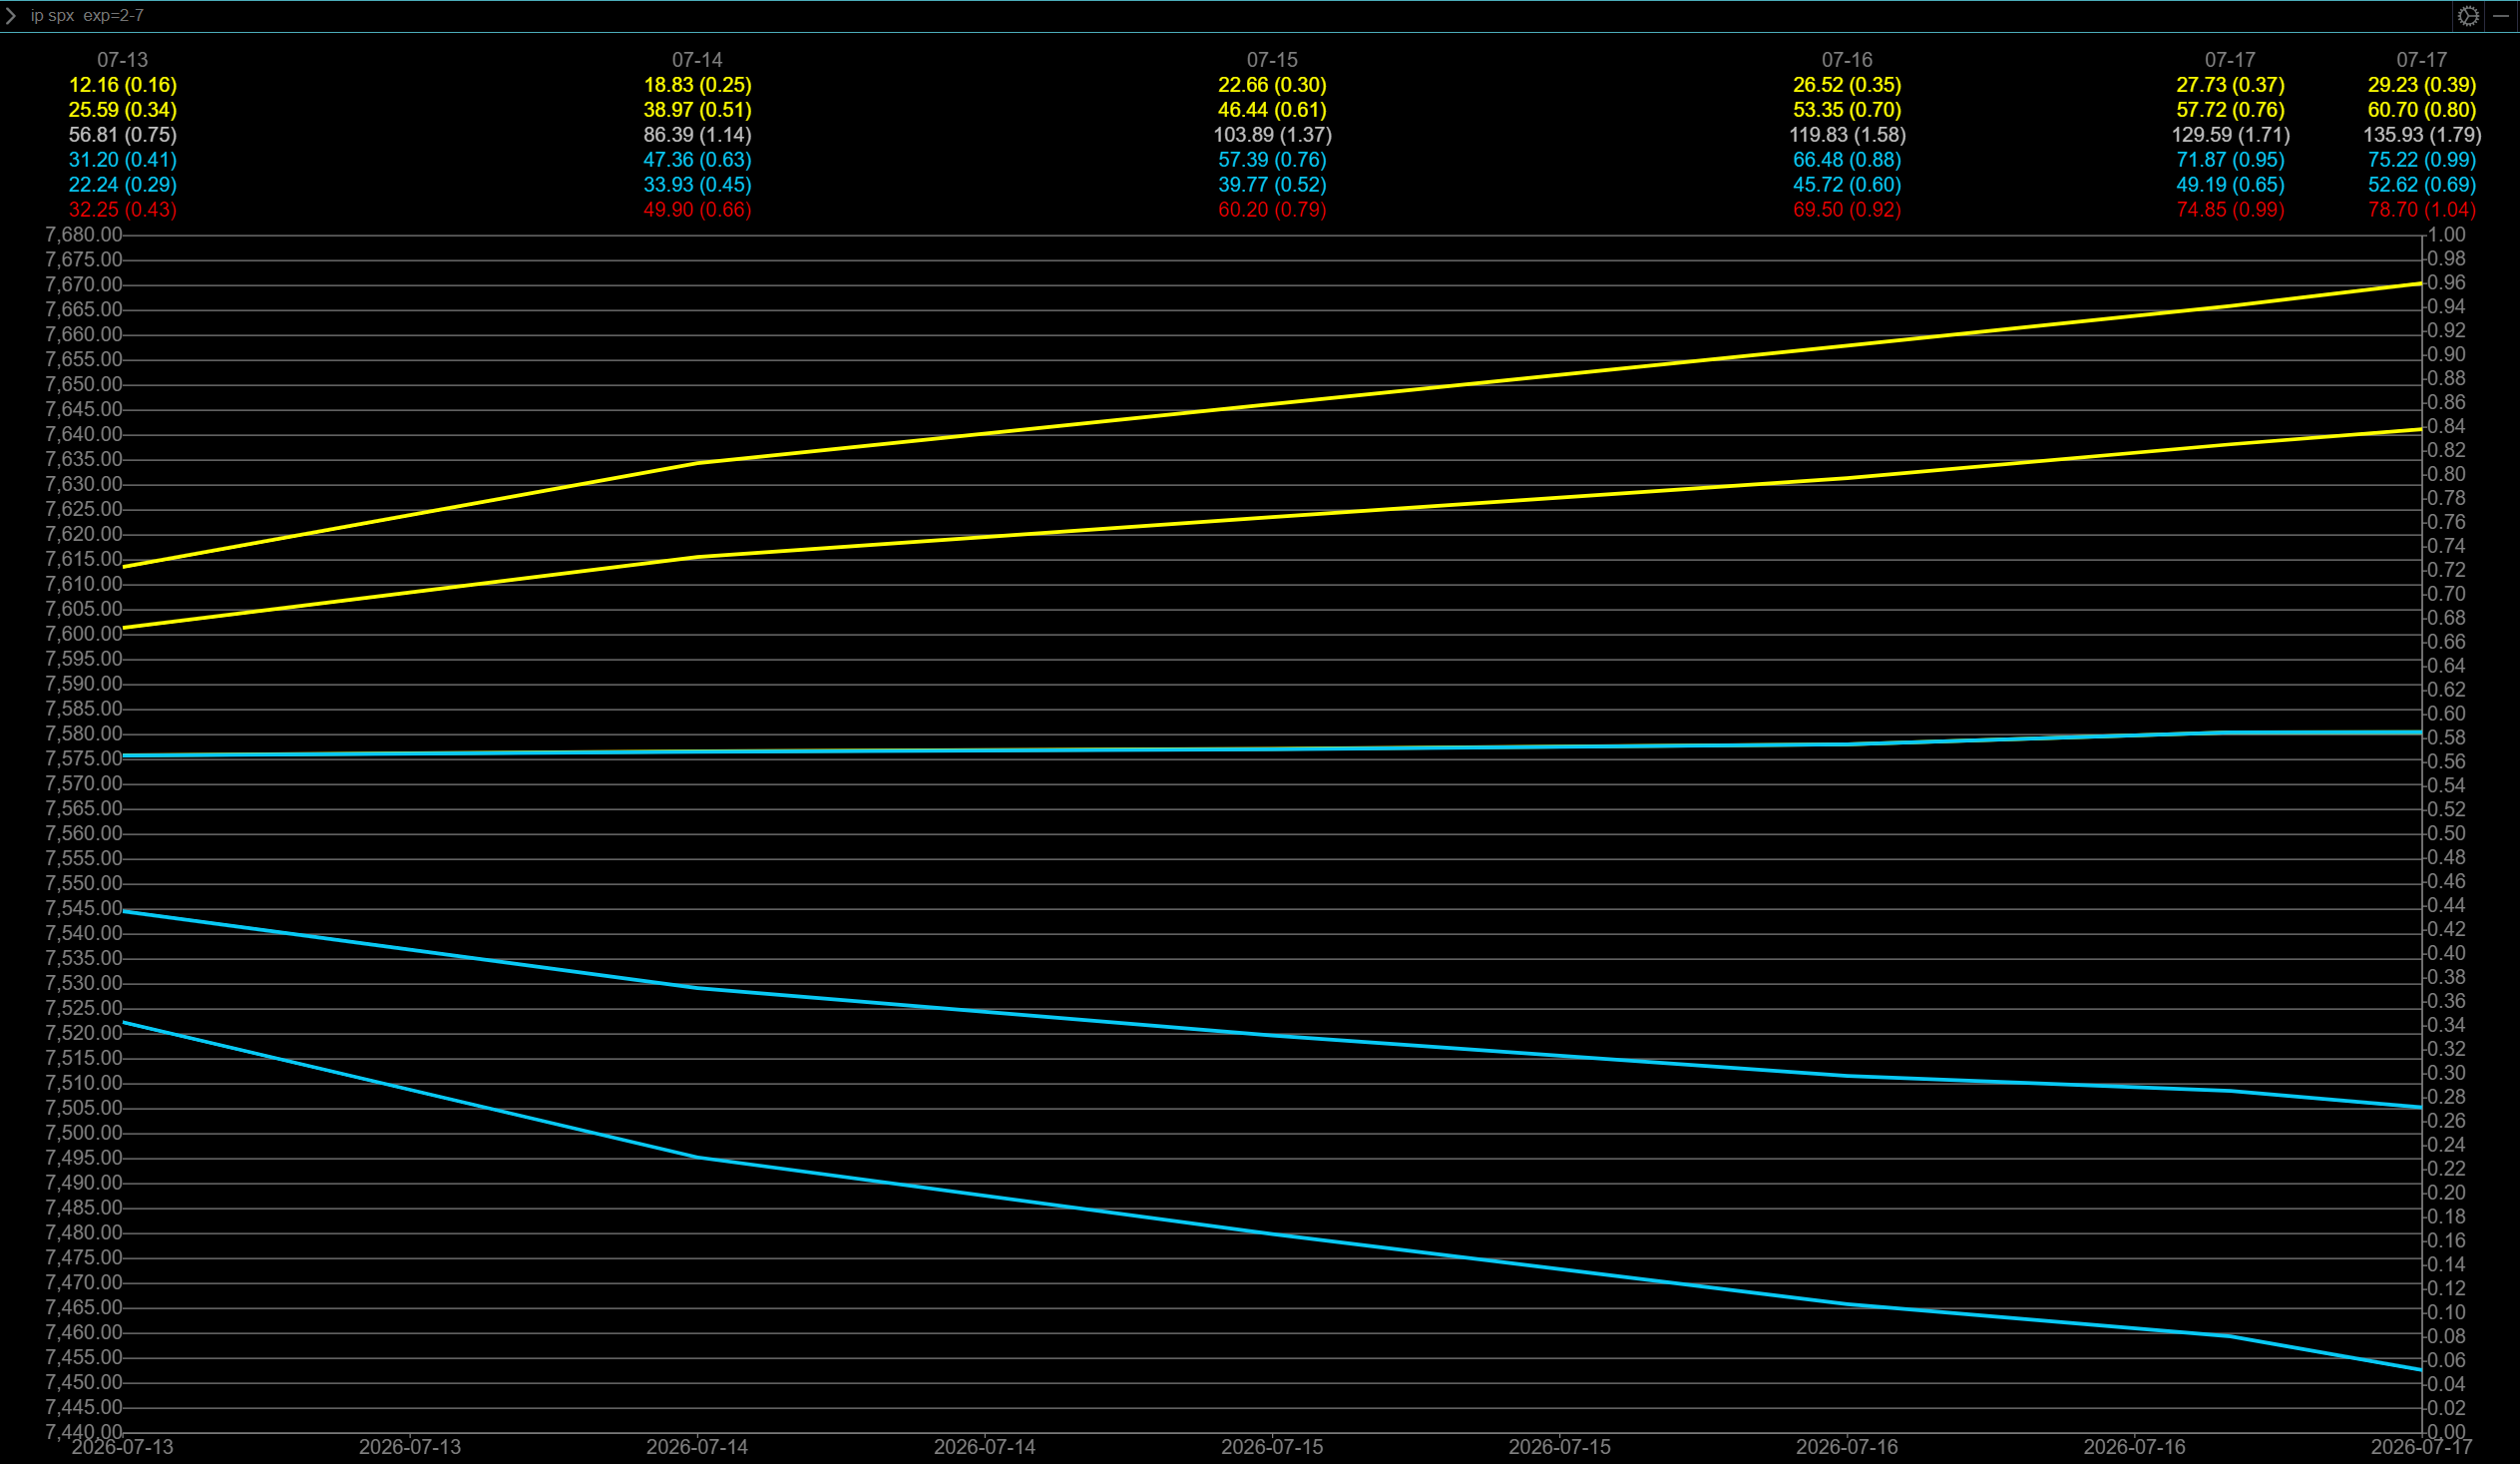
Weekly Straddle Range: 78pt straddle implies a weekly range of [7497, 7653]
July MOPEX Straddle: 232 pt range implies a OPEX to OPEX range of [7268, 7733]
September QOPEX Straddle is 459 pt giving us a range of [7041, 7960]
This is from June OPEX
DEC2025 OPEX to DEC2026 OPEX is 945 points giving us a range of [5889,7779]
Term Structure
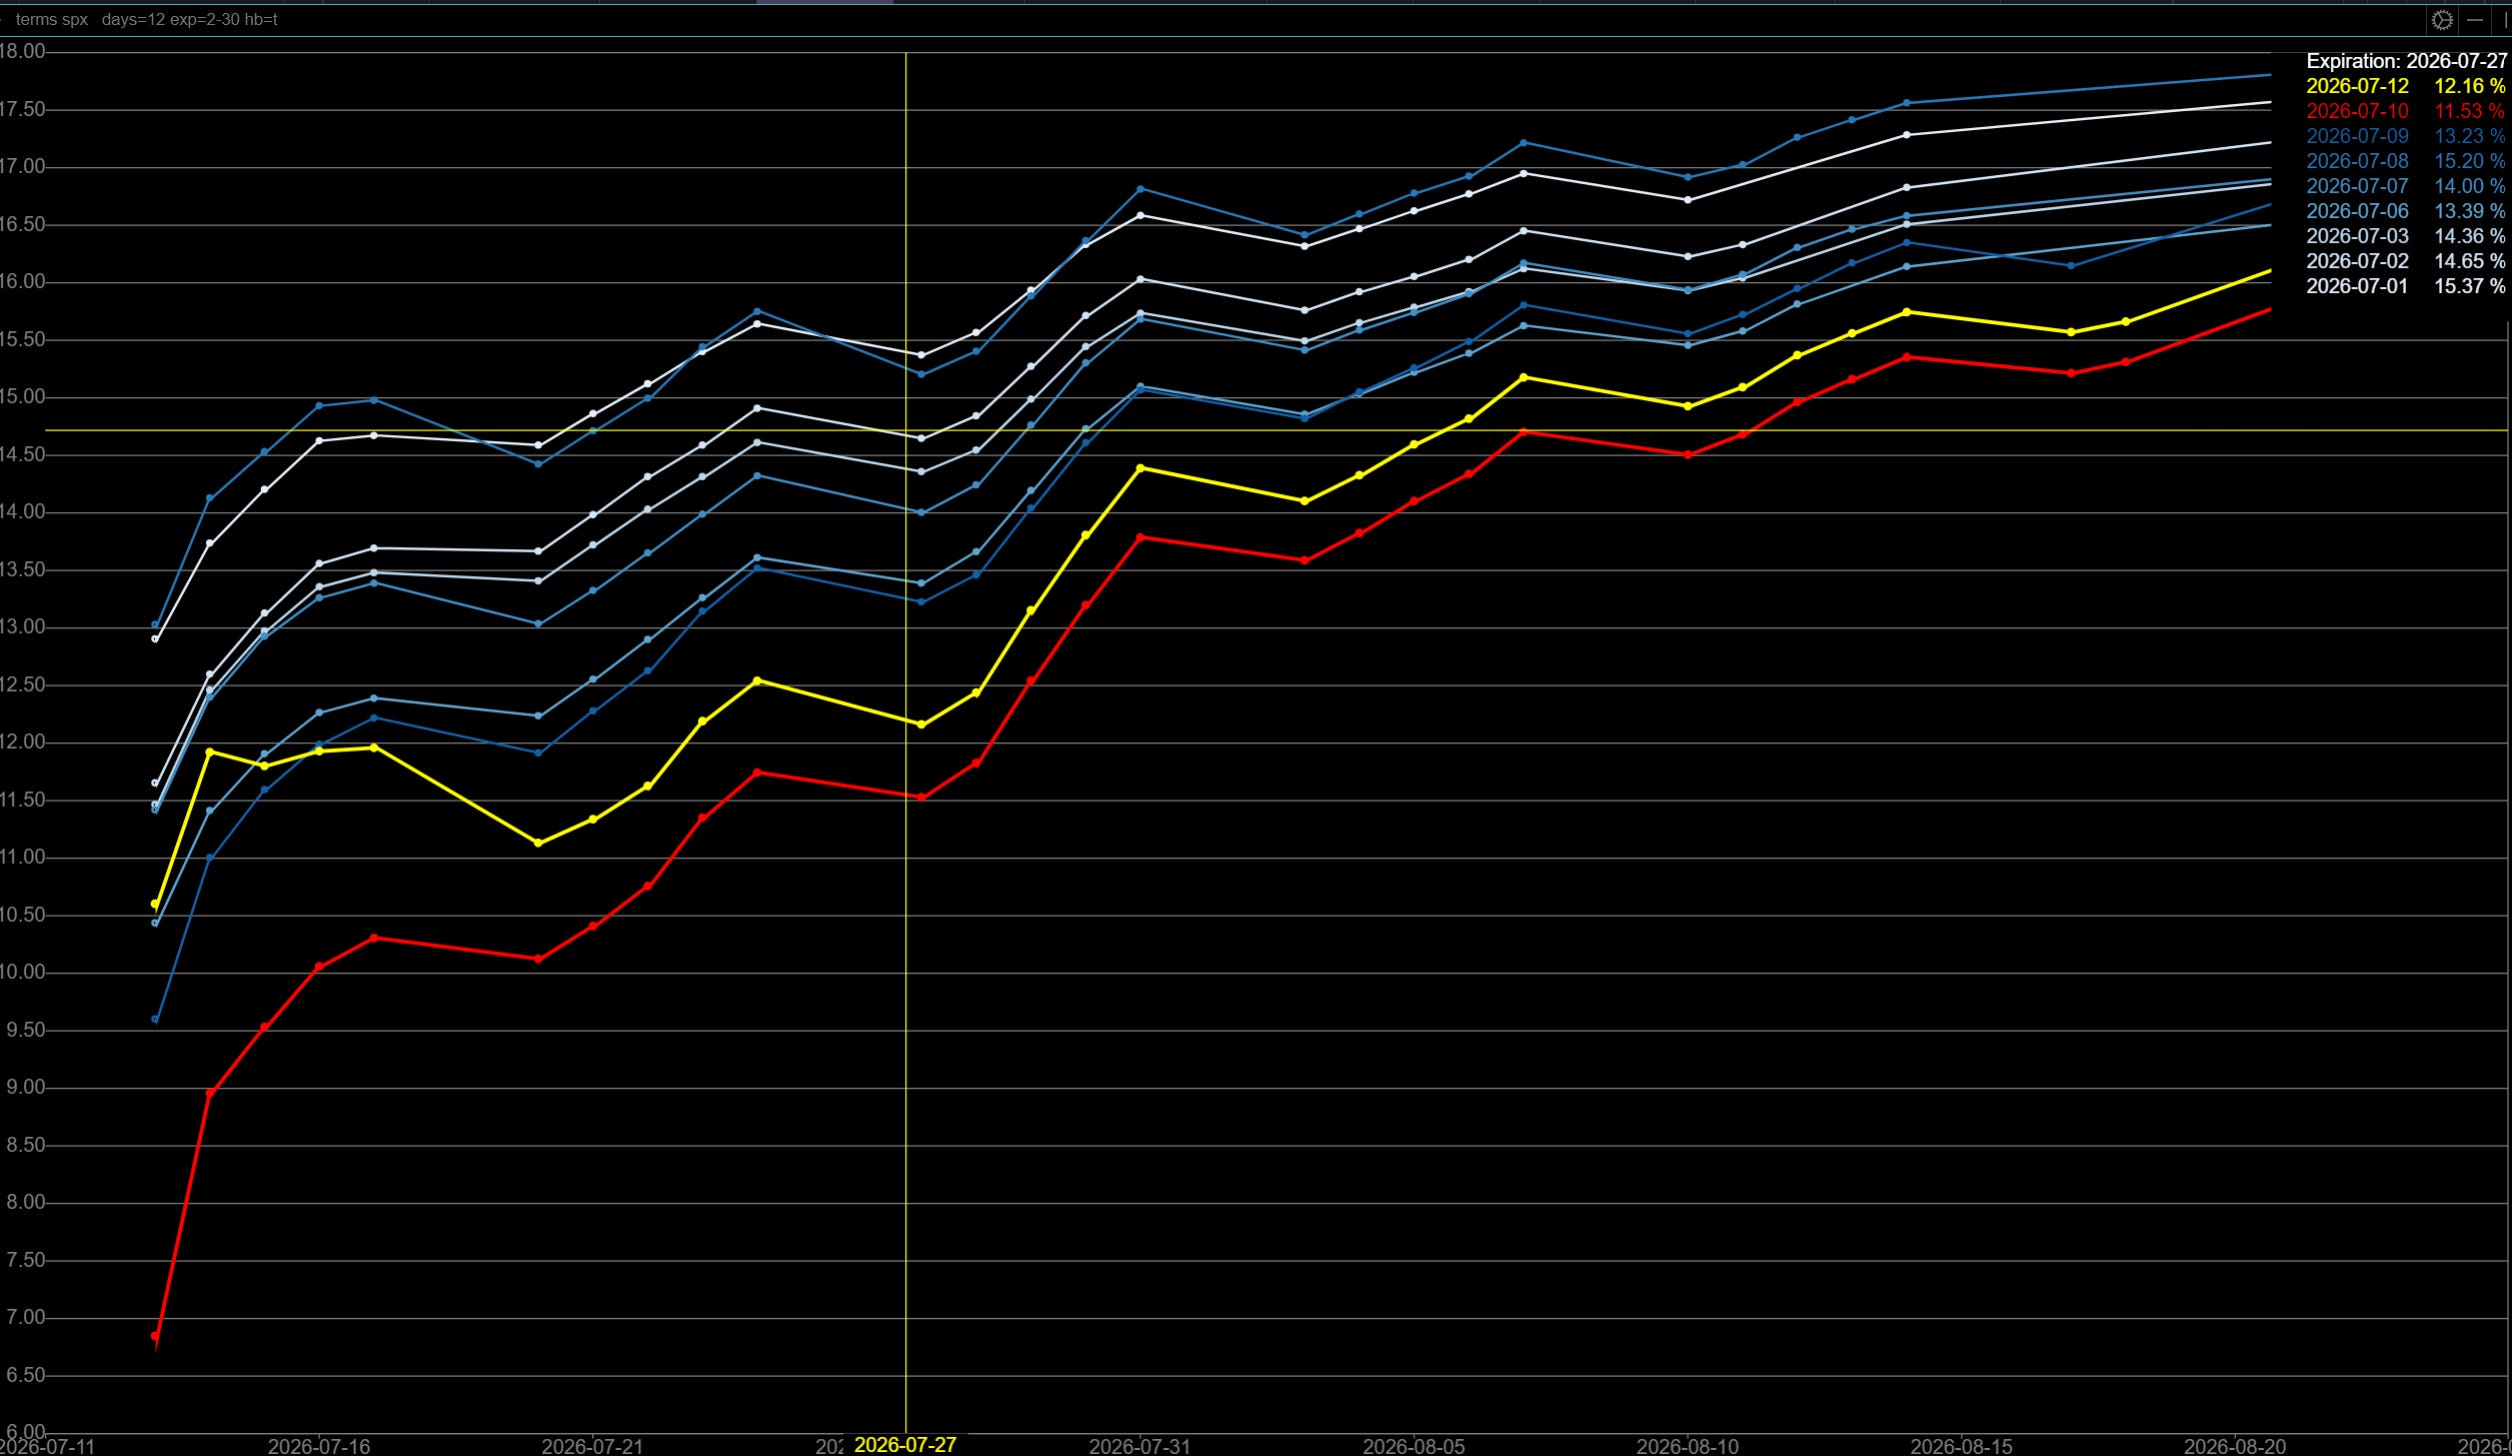
Term structure is pretty much at the lows - no fear in the market. Monday is low volatility expectations that generally remains elevated into OPEX and data releases before increasing into earnings season in the back half of July.
VIX Futures Curve
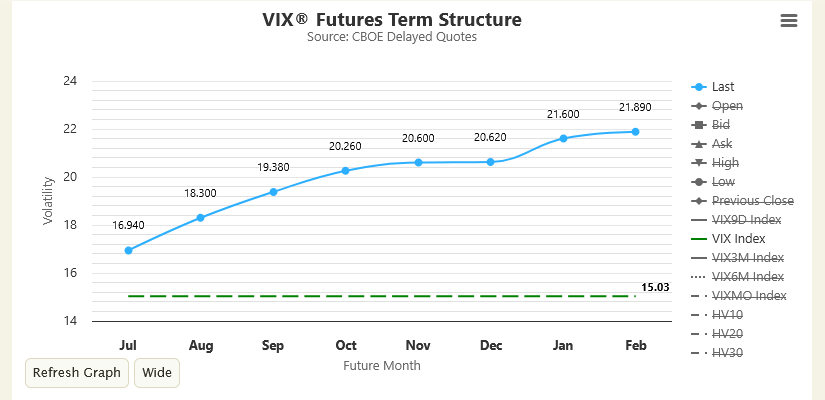
Curve looks fine - no fear/panic. Just a normal VIX curve and dip buys will continue to work. Until spot VOL is over front two months, we remain in a structurally BTD environment - If that happens, it’s a bit of a short the rip environment until it resolves.
Surface Models
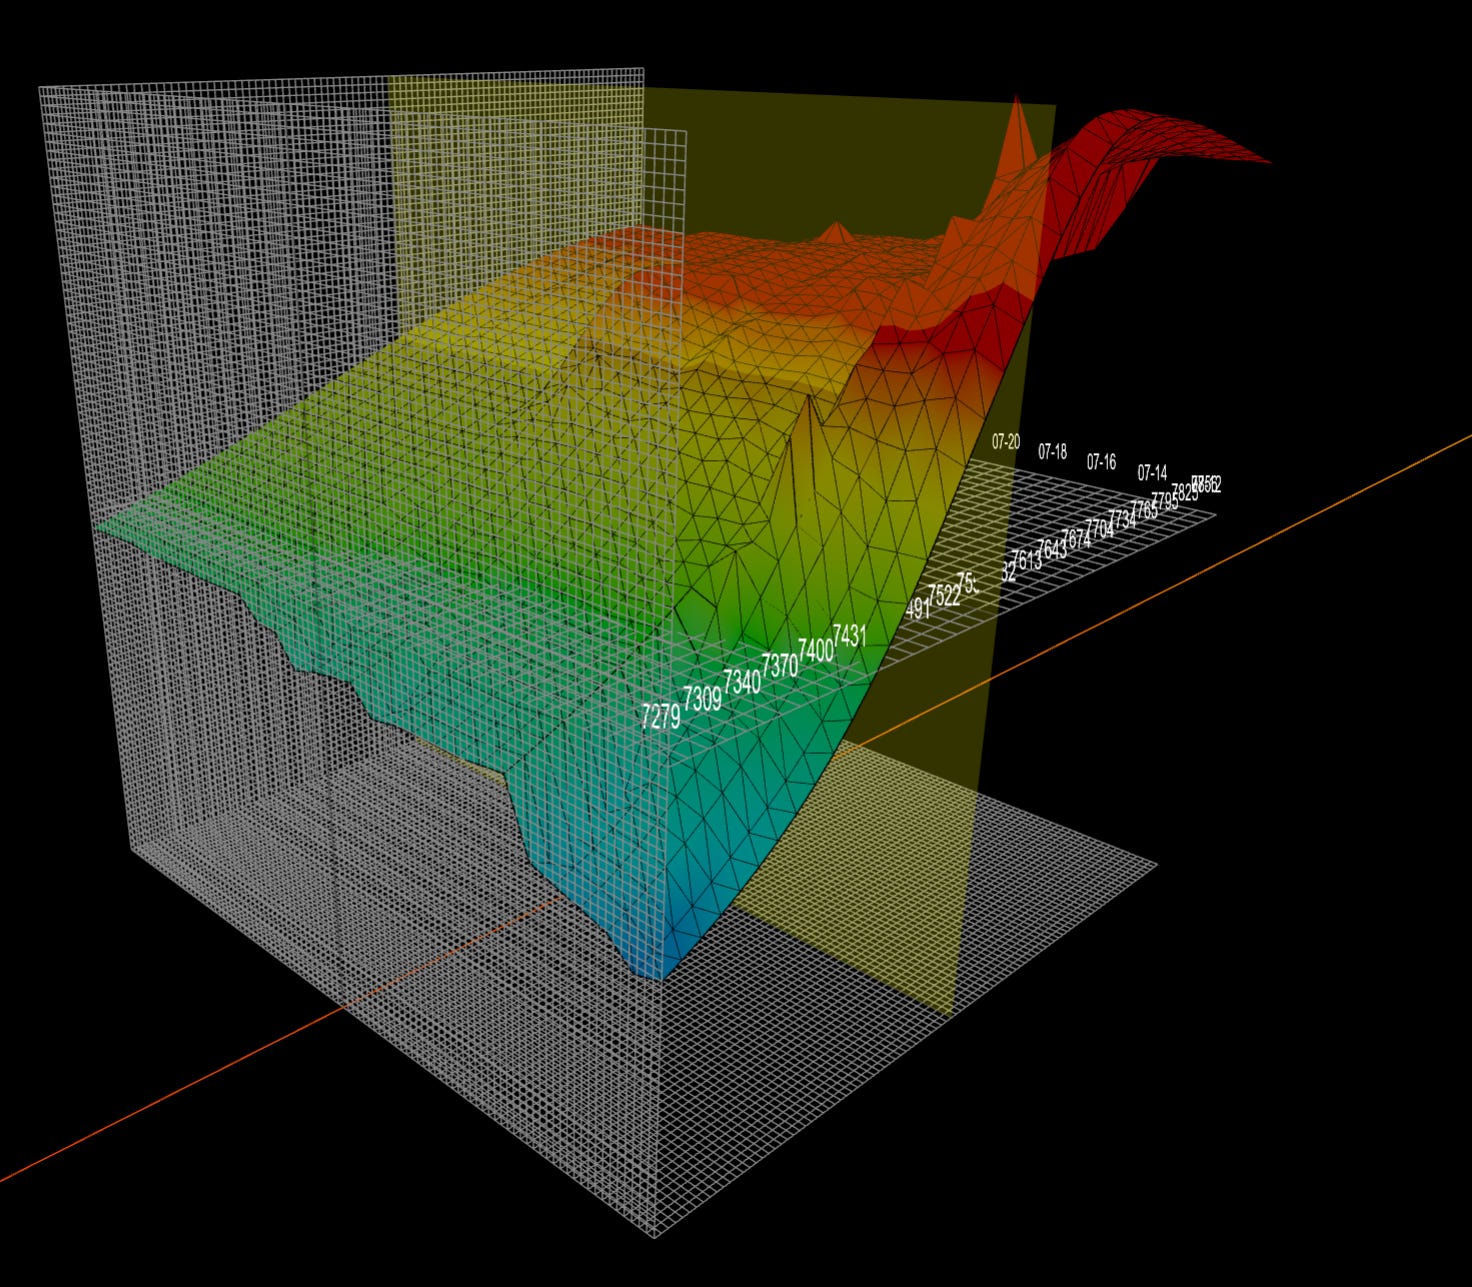
As of Friday morning, we’re over the gamma flip at 7450 with a steep upside surface overhead.
Realized Volatility
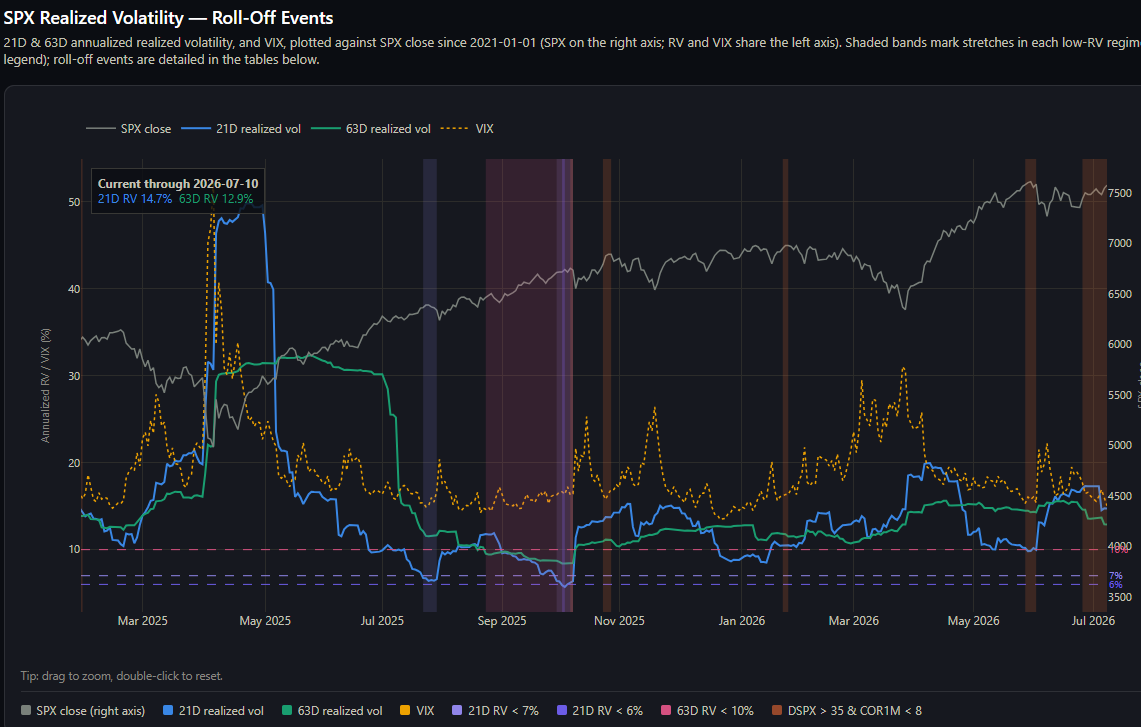
The next major RV dropoff began on July 8th and ends around July 16th with a smaller roll off from 07/20 to 07/23. An RV warning period opened on 07/08 (but the main signal is on 07/13 and lasts 7 days) - That likely sets up a quick move down in that period. 0DTE positioning might indicate when that specifically might occur.
How might it look for the next week and two weeks?
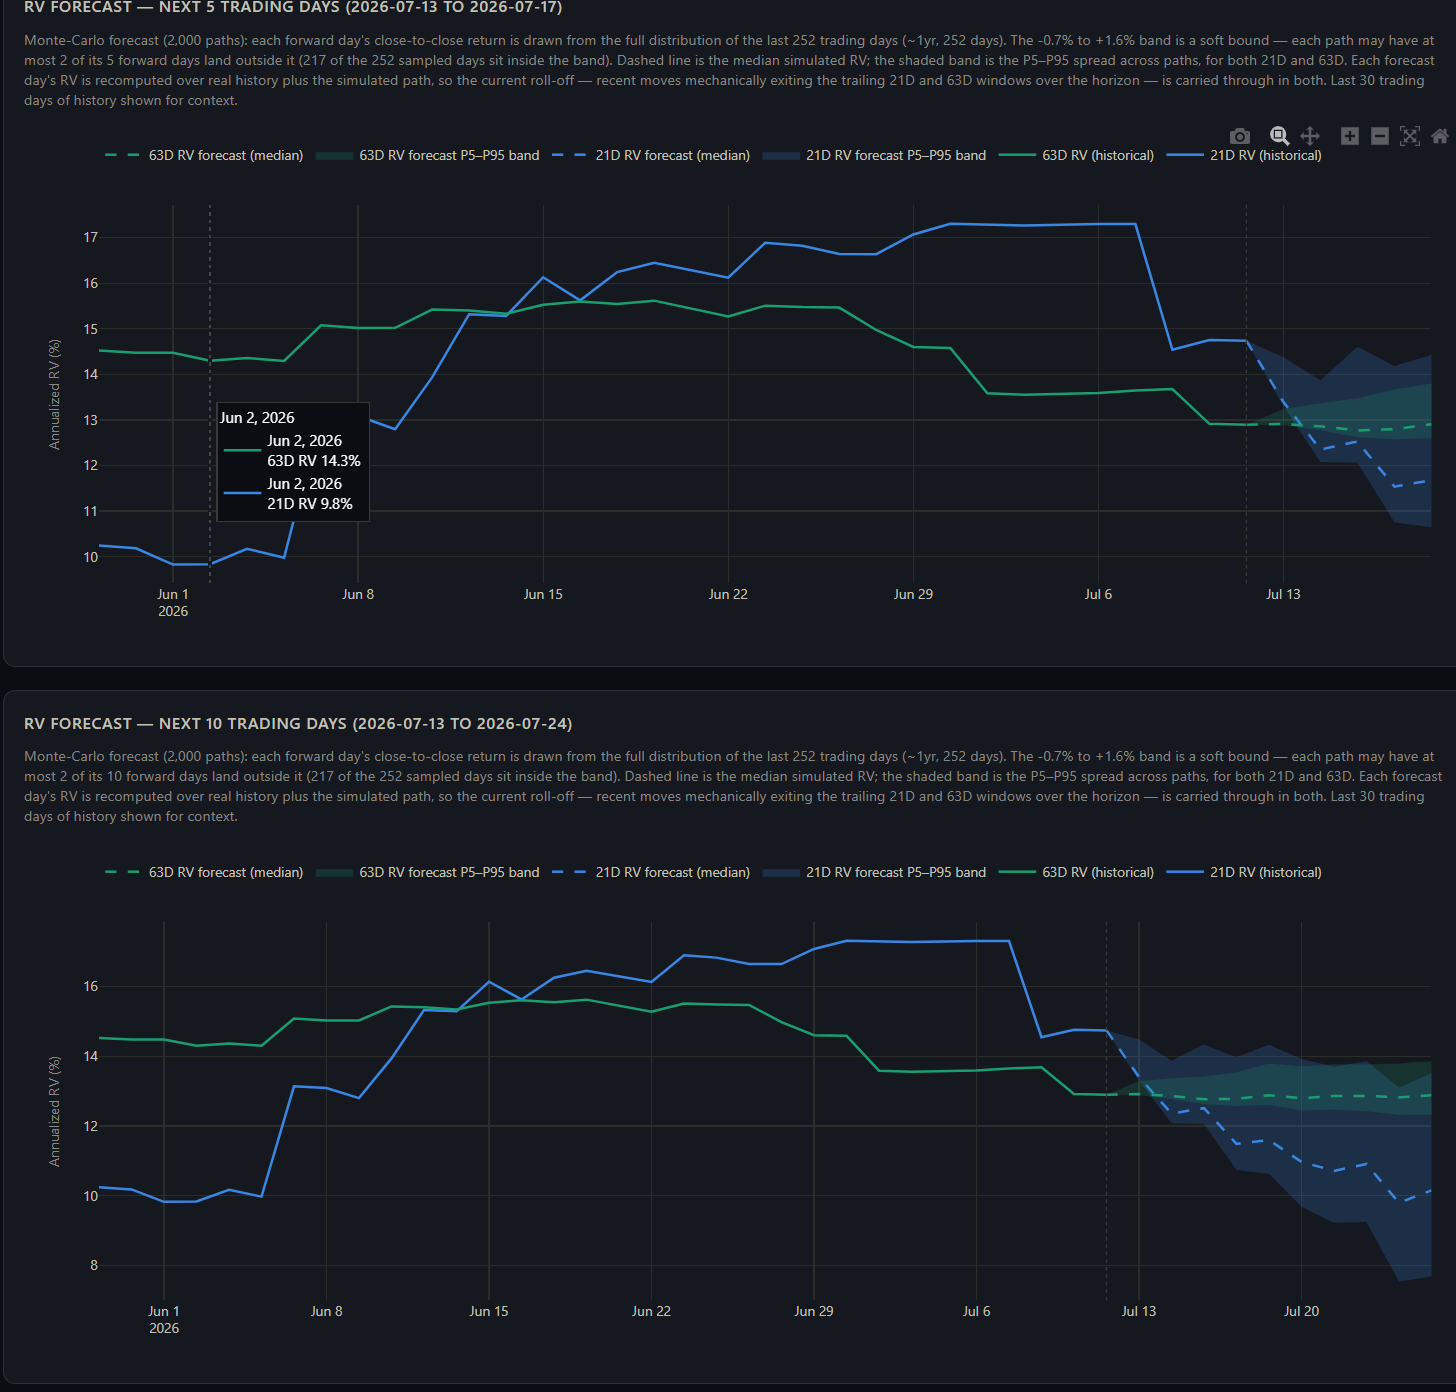
As RV drops, it’s a lift in liquidity as Vol control funds enter the picture. Let’s see what happens.
SPX Net positioning (Aggregate)
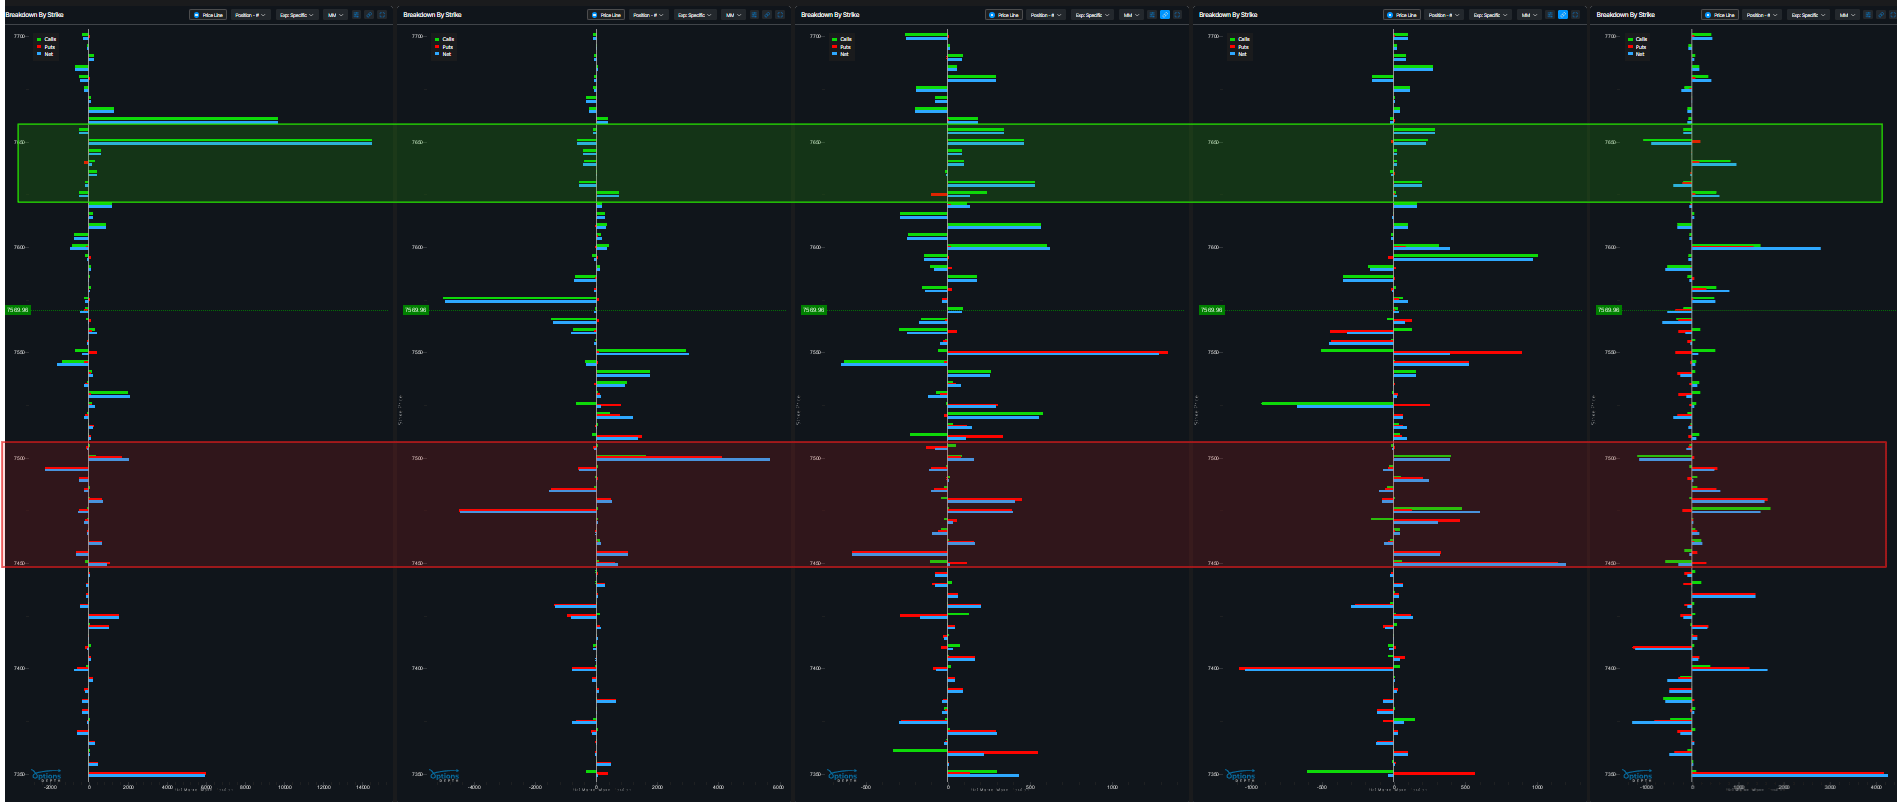
Aggregate Through EOW
The snapshot above is from 7250 to 7750
How to read
Green: Calls
Blue: Puts
Red: Net
Left: Dealer Short (Market net bought)
Right: Dealer Long (Market Net sold)
What stands out the most to you?
Market is look poised to stay within a range into earnings but let’s see the day to day adjustments as the week goes on.
If you would like your own OptionsDepth Account and think my overviews are valuable, please consider using this referral link:
https://optionsdepth.com/app?via=Yamco
Technical Structure of the market (breadth)
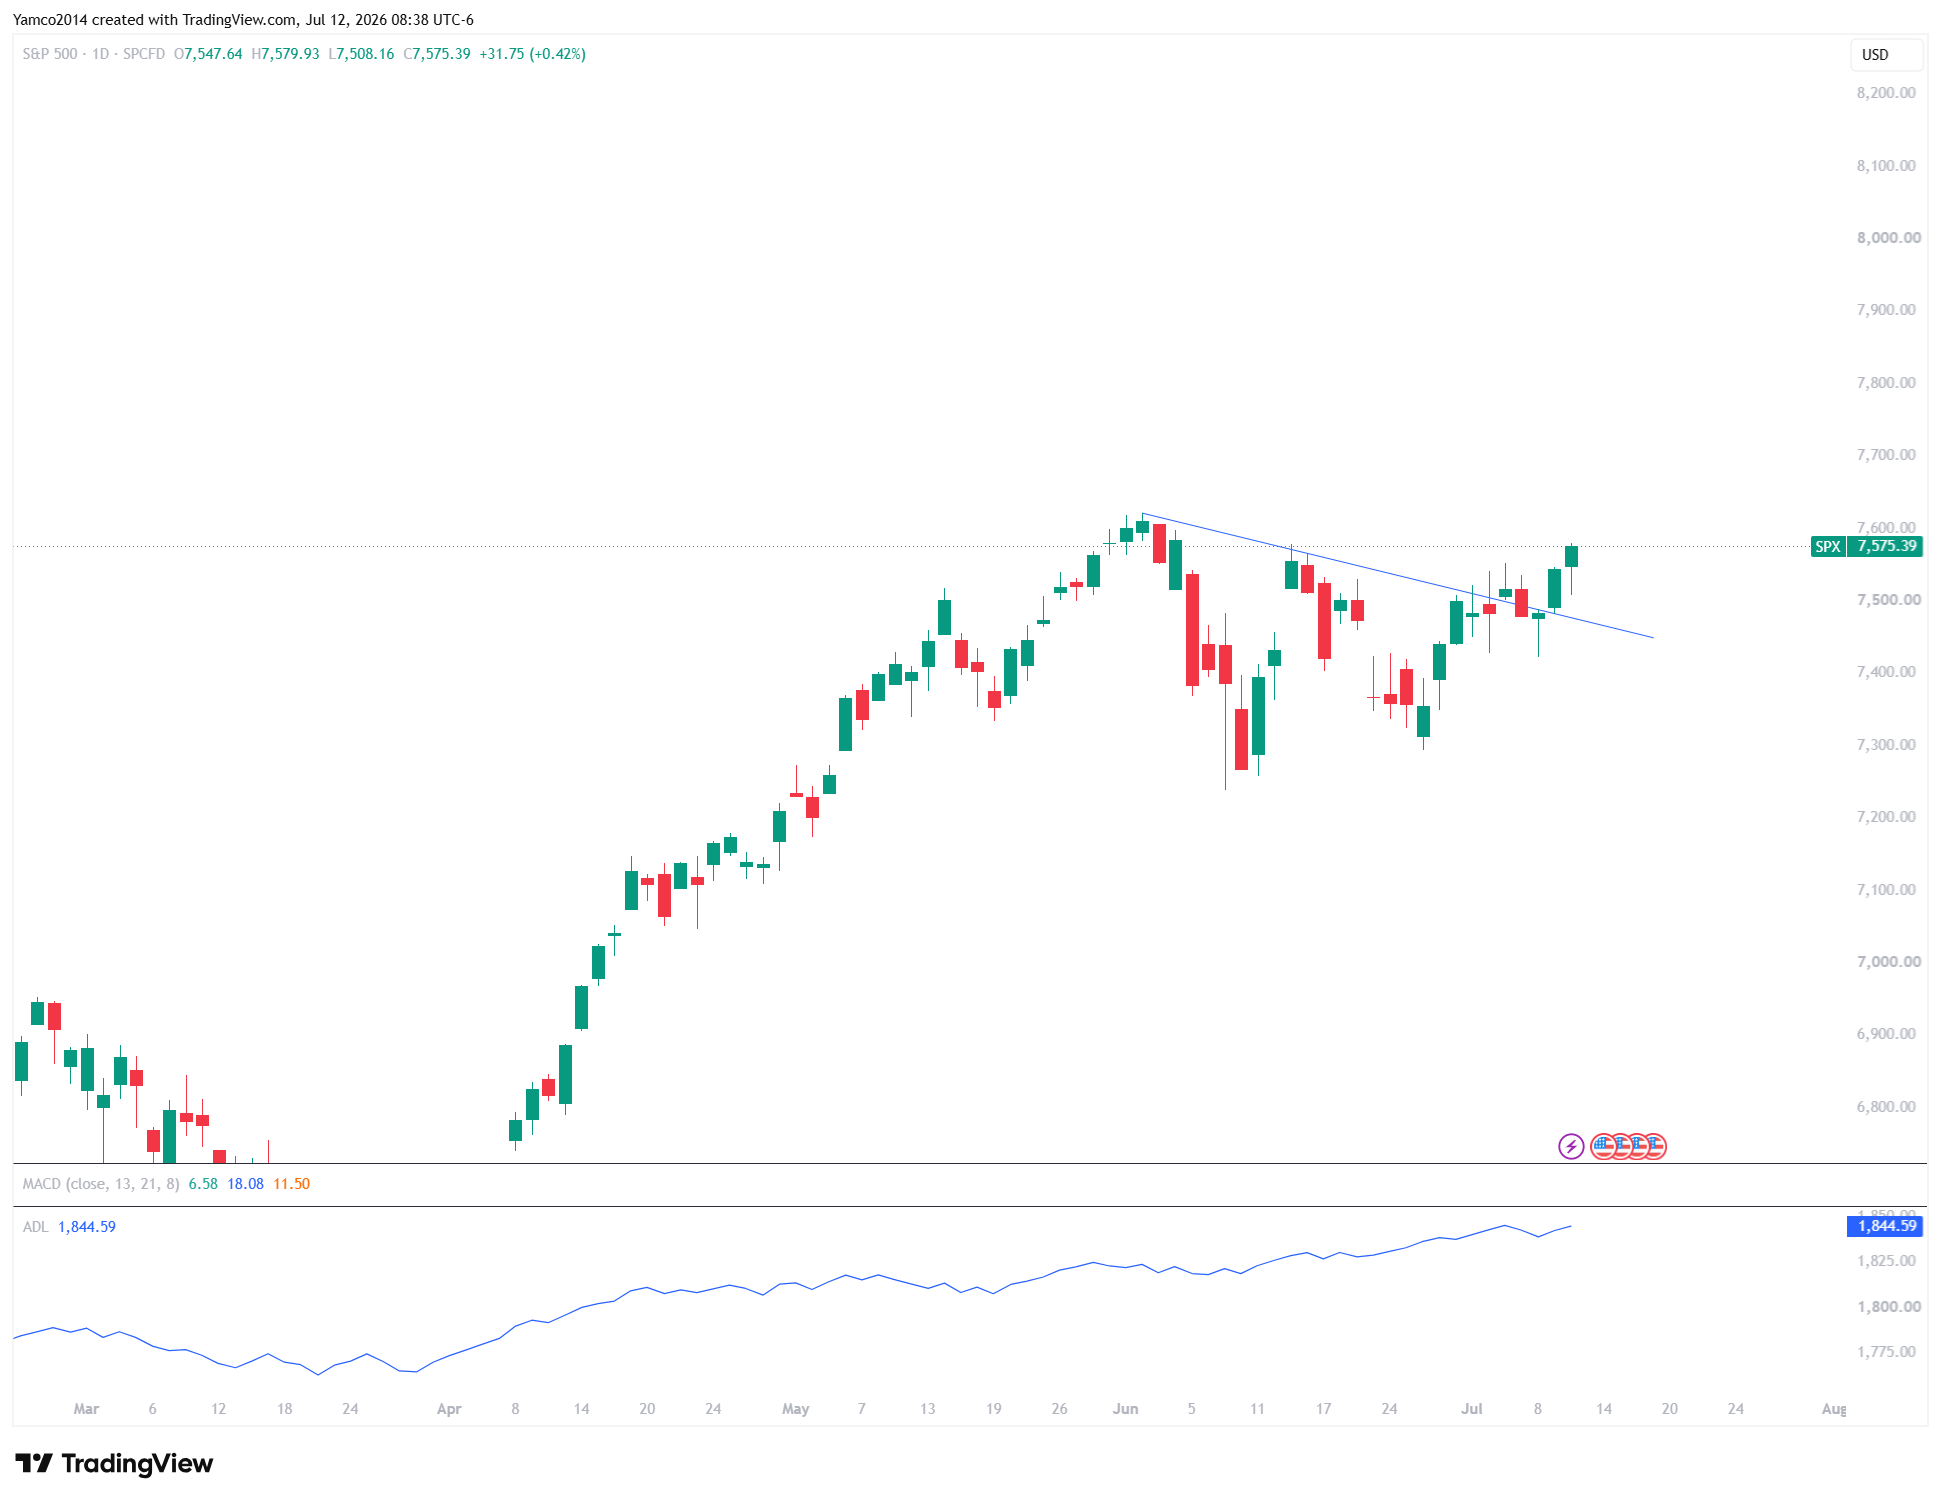
Advance Decline Line
Short term, the ADL is at highs while the market is just off ATHs - the question on my mind now is are we going to see a de-risking event (RV event) or is this a false signal?
Percentage of stocks over moving averages
5 Day - SF5D
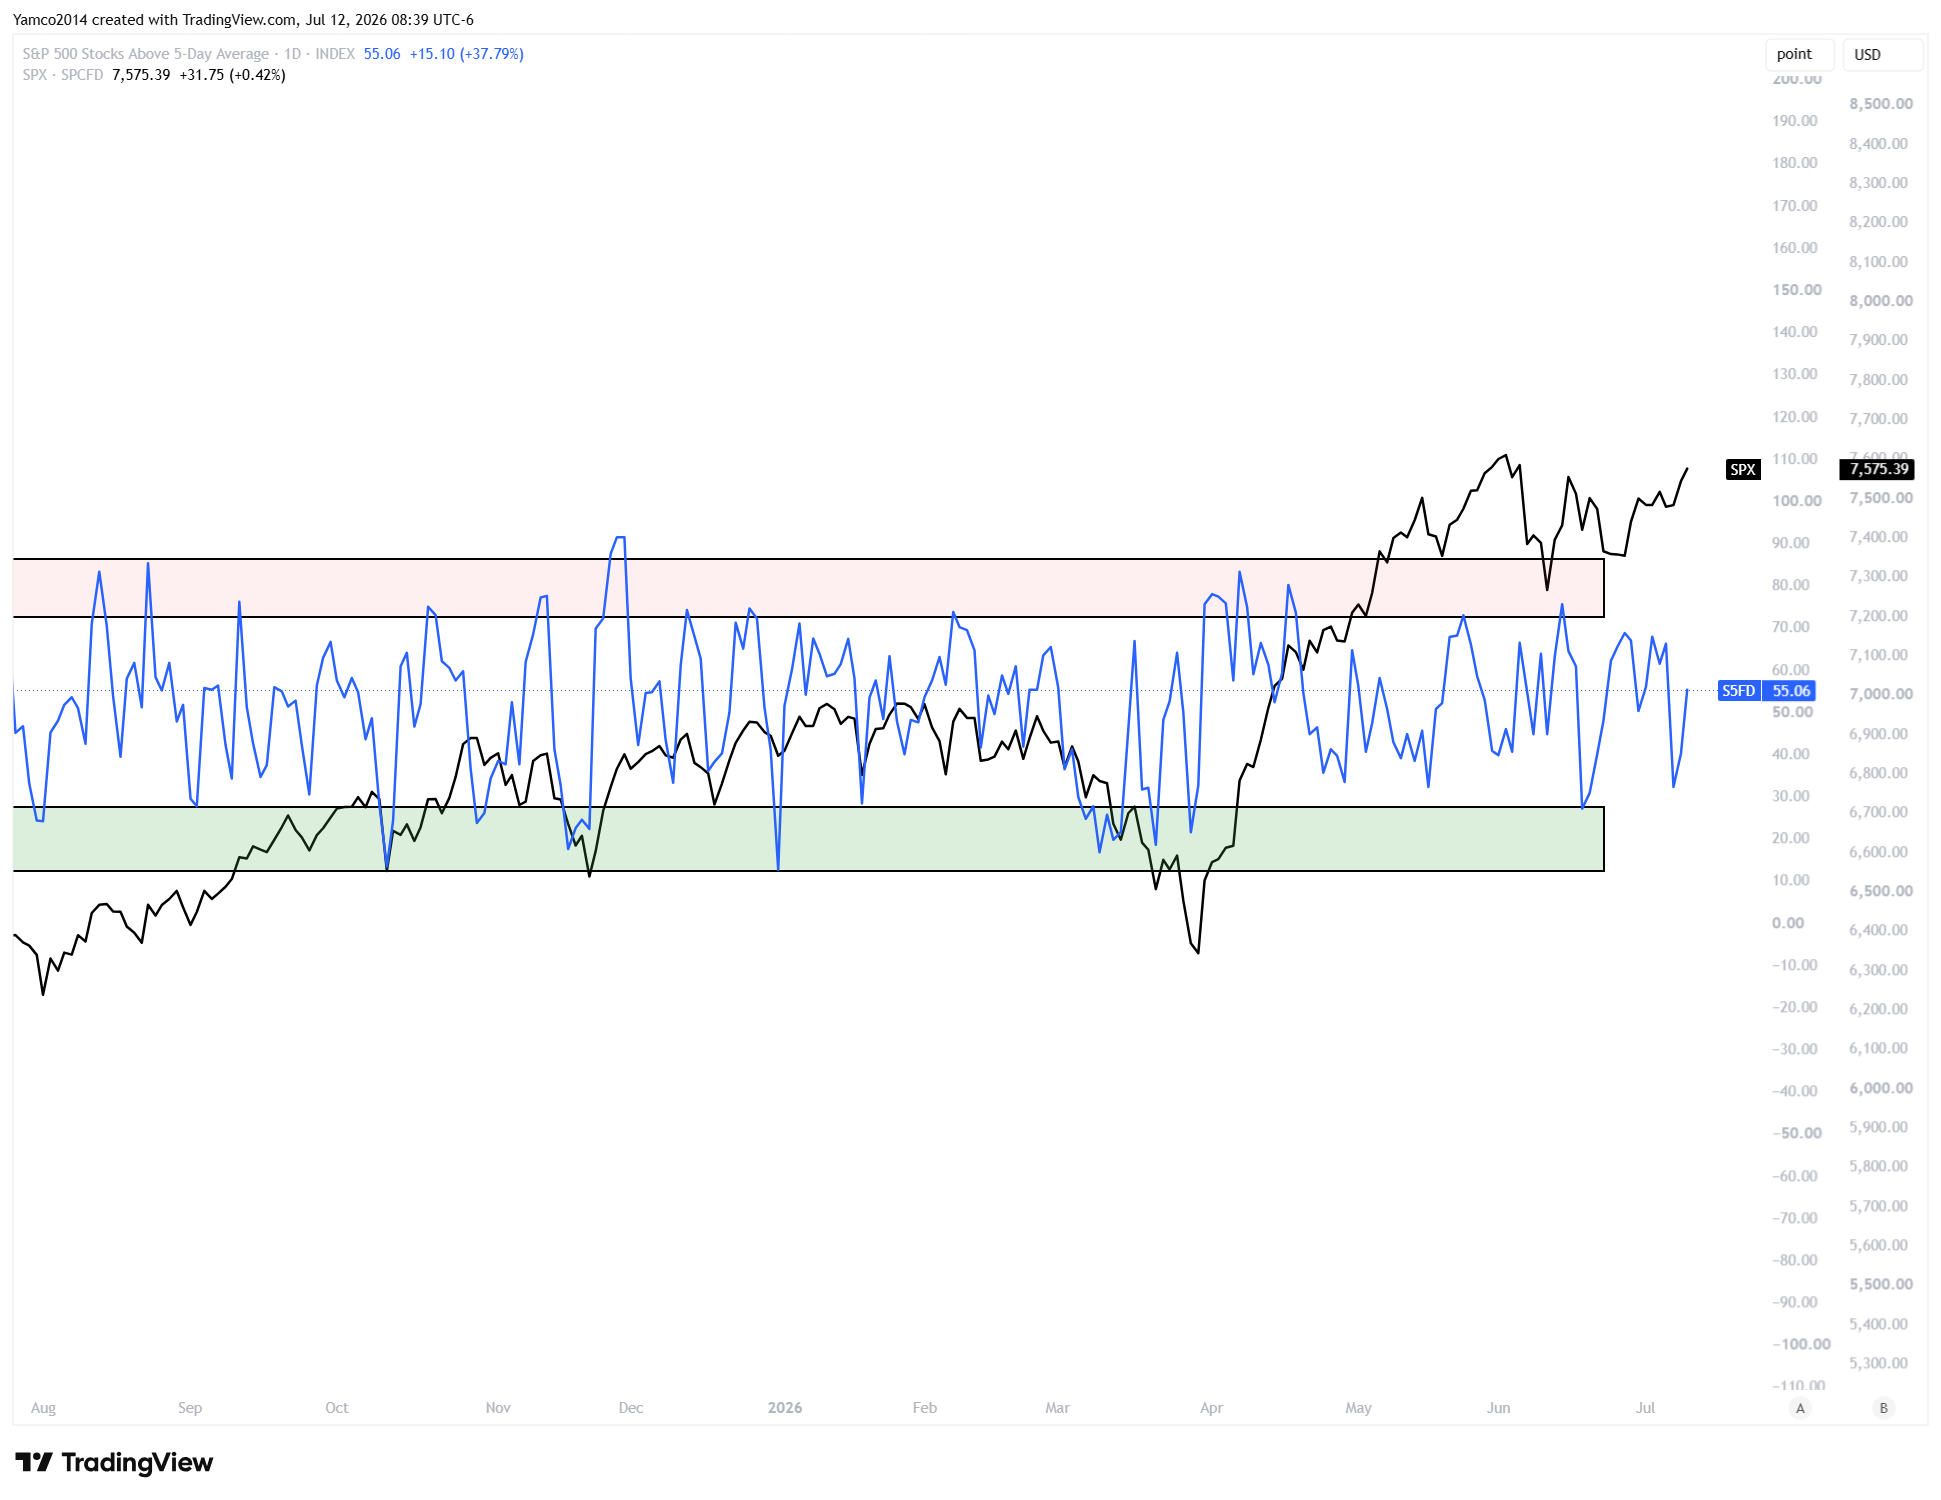
This metric tracks the percentage of SP500 stocks above their relative 5-Day moving average - It’s near the top of the range but rapidly shifts around.
How to Read
Blue Line = S5FD
Black Line = SPX
Green Box = S5FD from 15-30
Red Box = SF5D from 70-90
Your eyes should pick up on the oversold/overbought conditions when S5FD reaches extremes - does it always work - depends what you think about wobbles and corrections in time. There’s nothing in short term that looks like a worry
Sentiment and Exposure
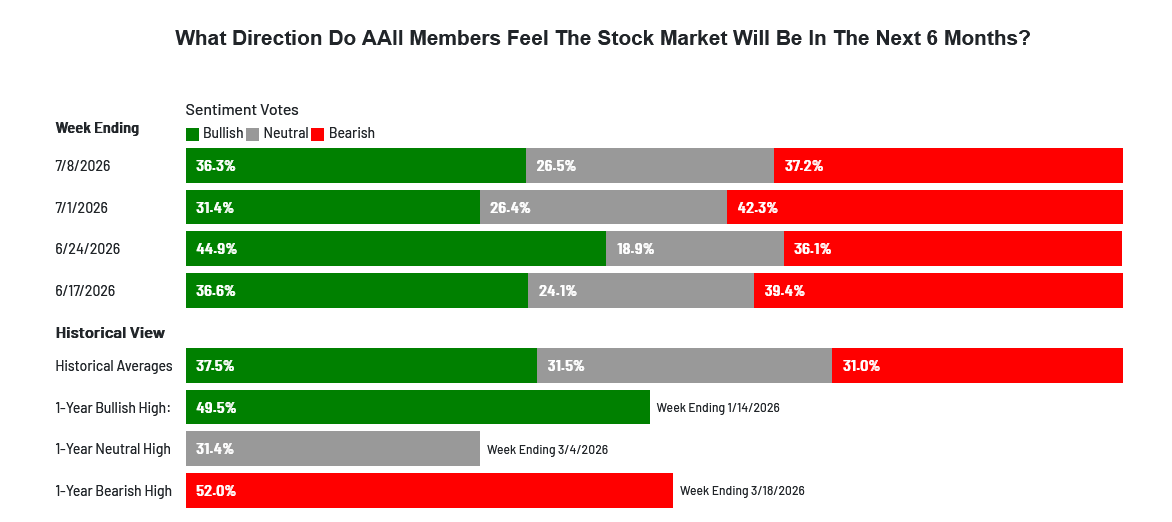
AAII is released on Thursday mornings
As of Thursday morning, investors are neutral again.
NAAIM Exposure
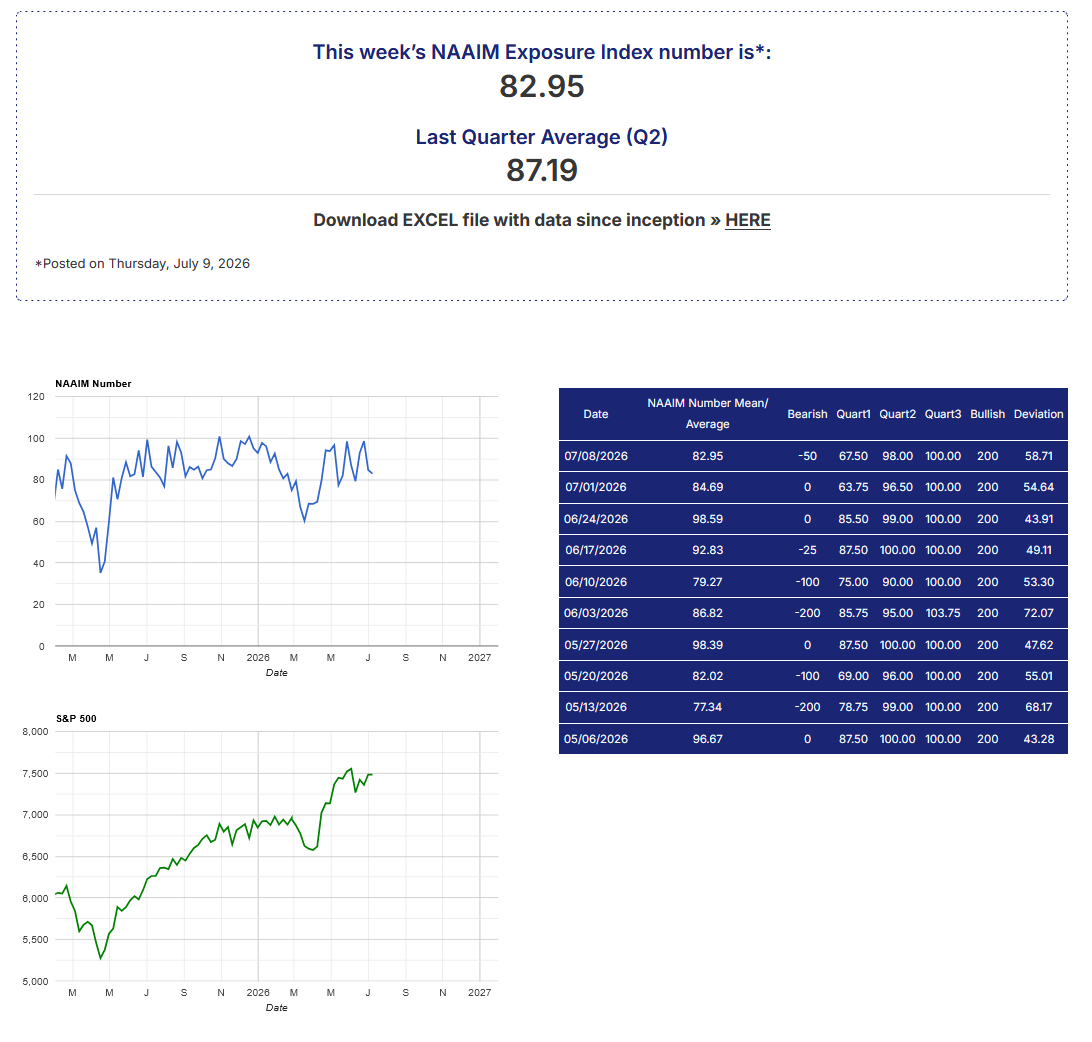
NAAIM member firms who are active money managers are asked each Wednesday to provide a number which represents their overall equity exposure at the market close. Responses can vary widely as indicated above. Responses are tallied and averaged to provide the average long (or short) position of all NAAIM managers, as a group.
As of Thursday, funds are generally back at de-risked levels from May-June. I mentioned last week, I expected to see a bit of a decrease here and we got it. The market has been long the same stocks and fund managers aren’t any different.
Metals (Silver/Gold)
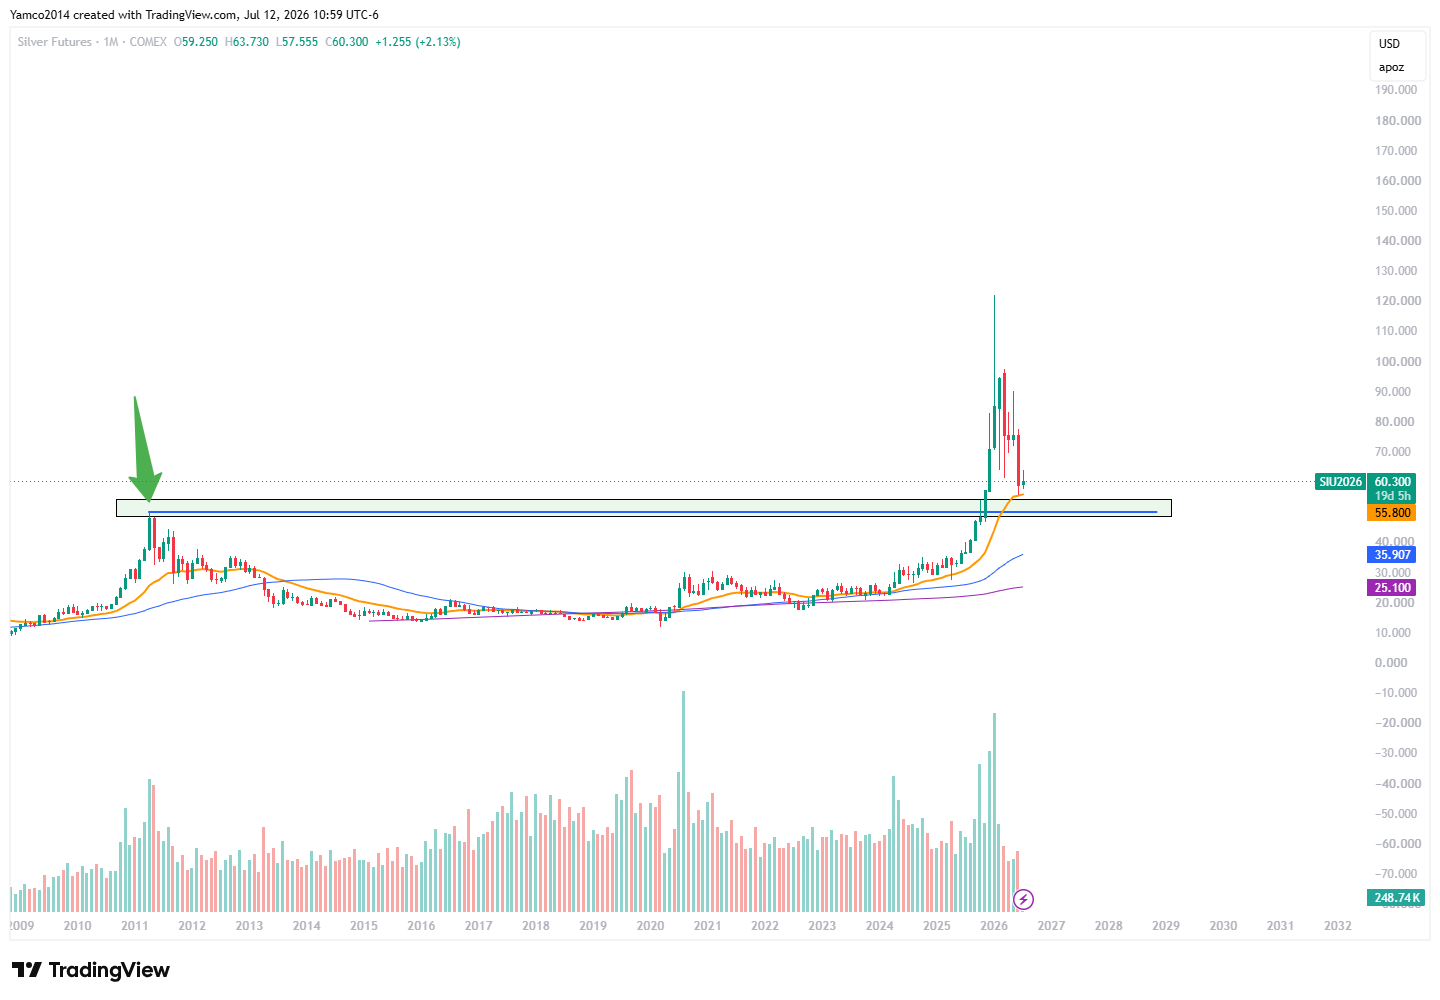
SLV 0.00%↑ (using Front Month Silver Futures)
Monthly scale
Weekly scale zoomed in
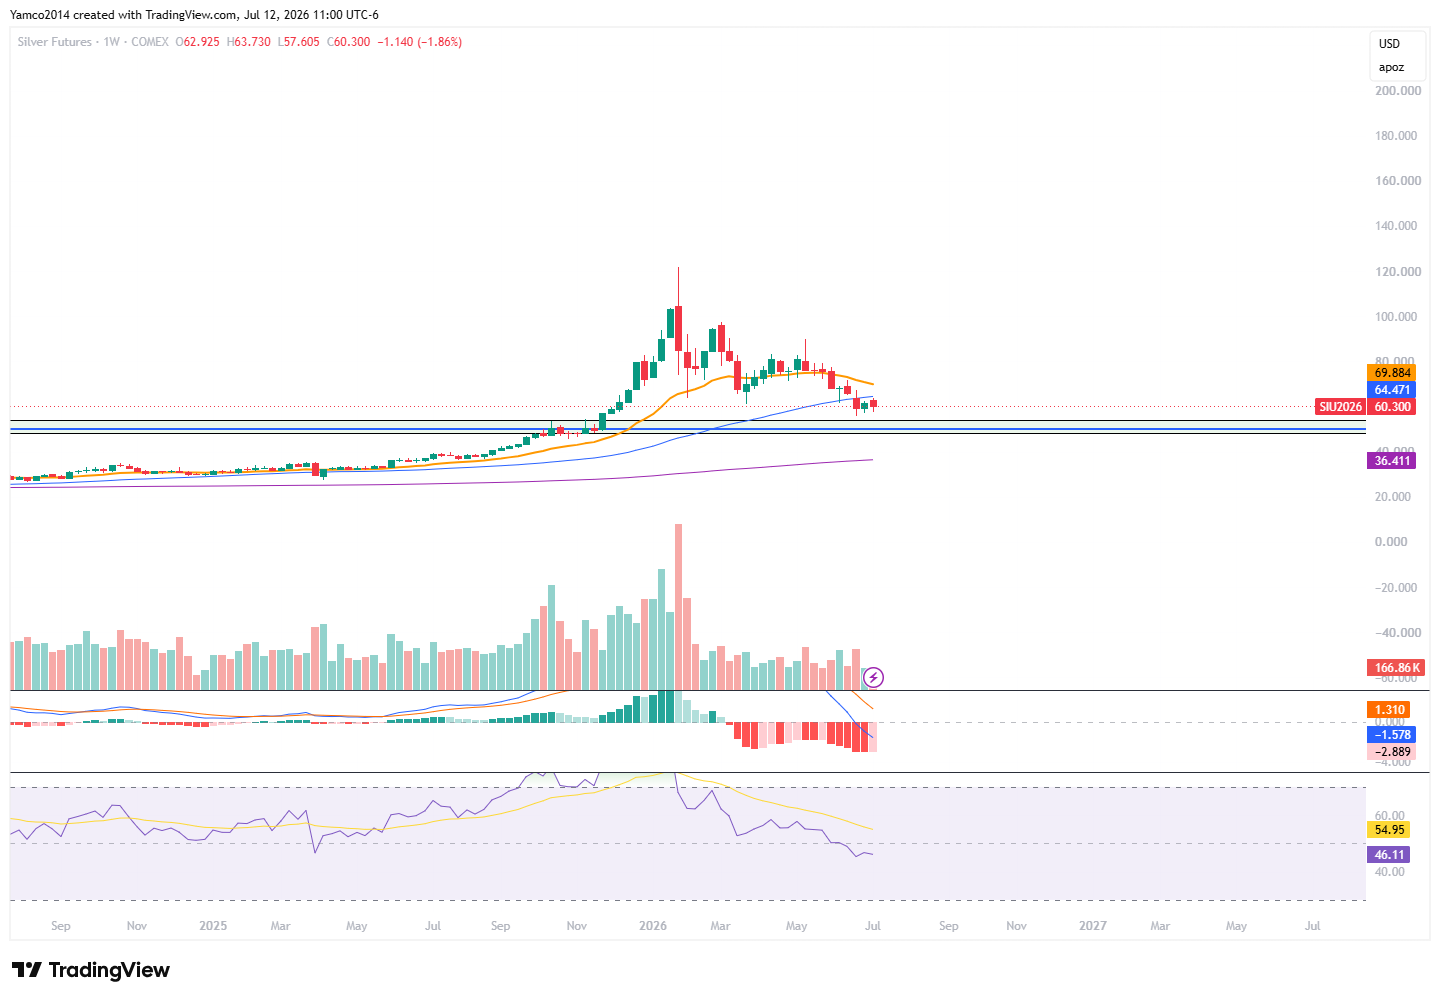
CPI can move metals sharply as rate hikes are priced in the forward fed curve - for now - momentum looks not so great while price appears to be setting a floor - an aggressive push down on a hot CPI would be a long term buying opportunity in my opinion based on how far it goes.
GLD 0.00%↑ (Using Front month Gold Futures)
Weekly
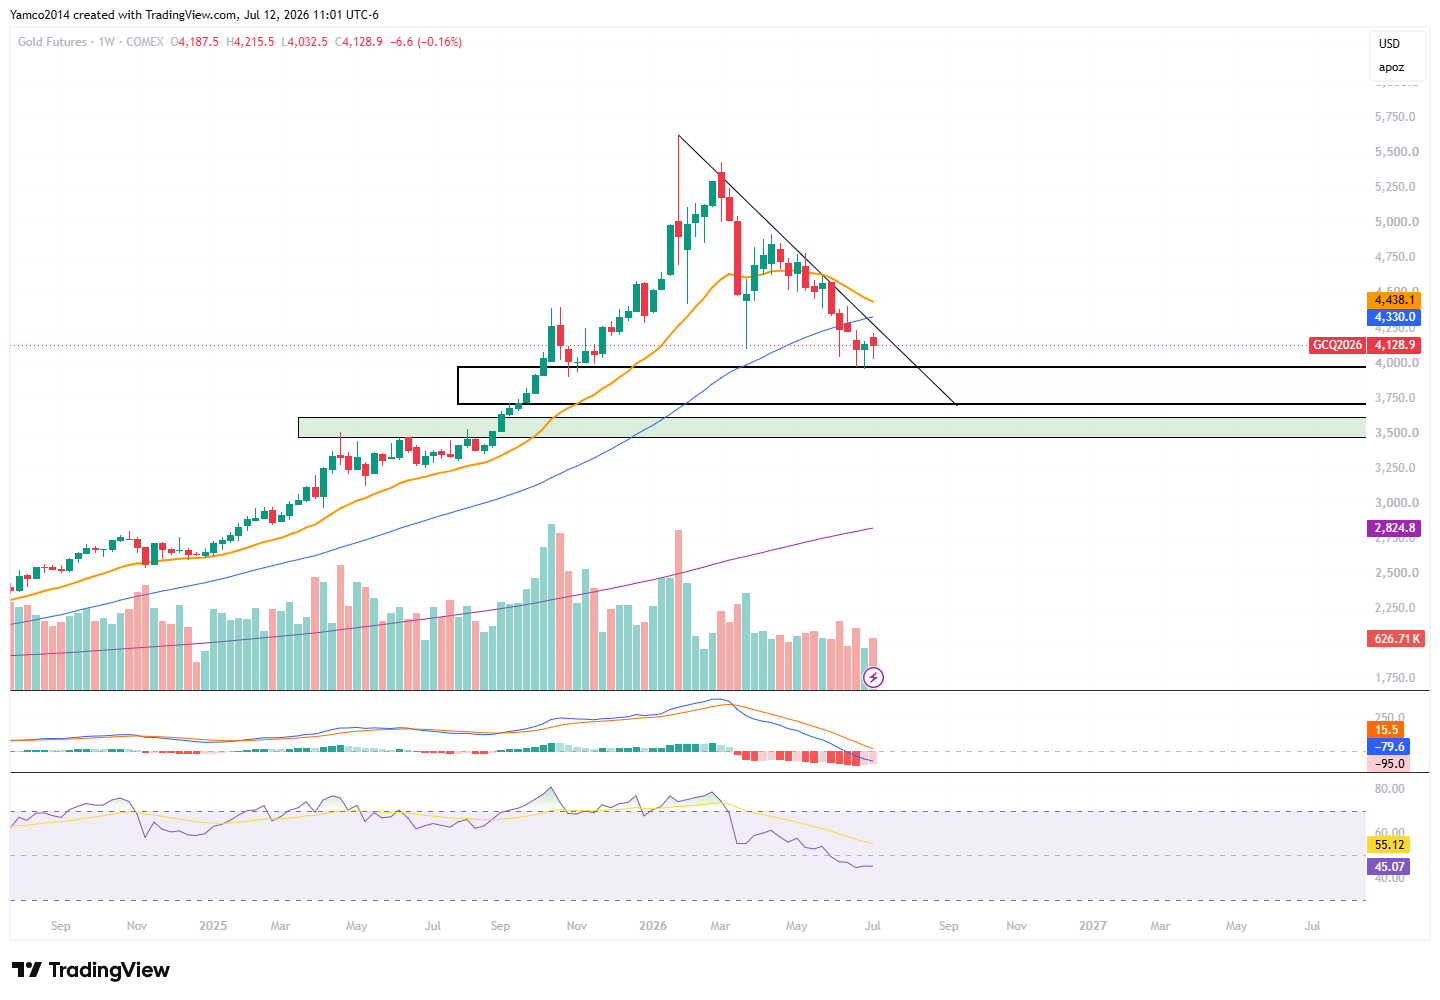
Momentum starting to curl - CPI will be the tell.
Daily
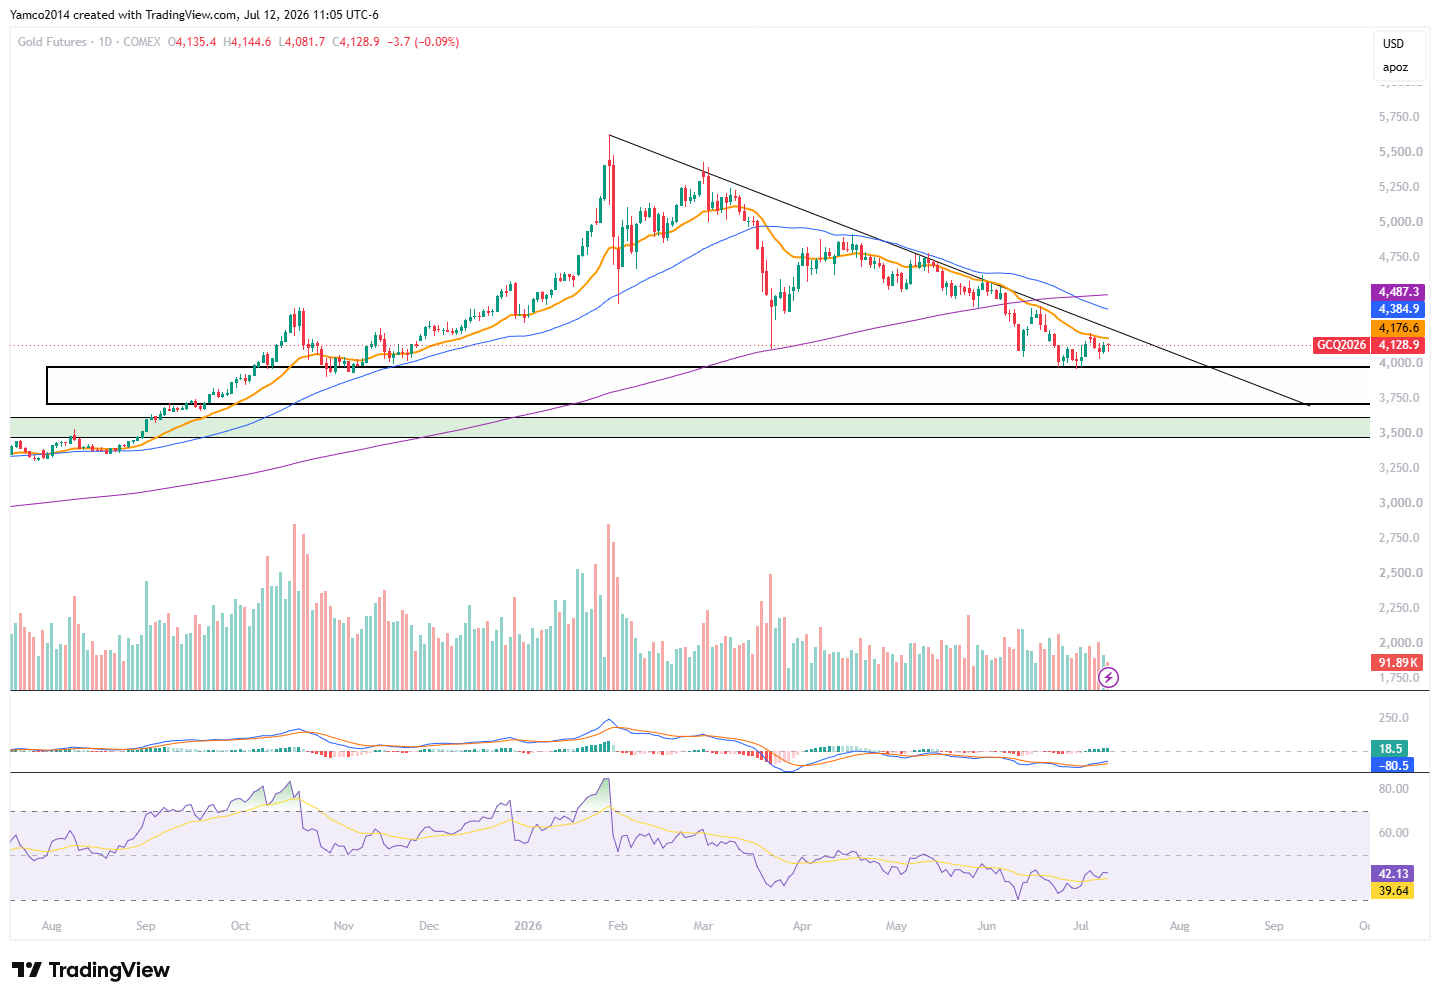
RSI divergence building while momentum is curling in this large downtrend consolidation break.
Key zones to watch (SPX)
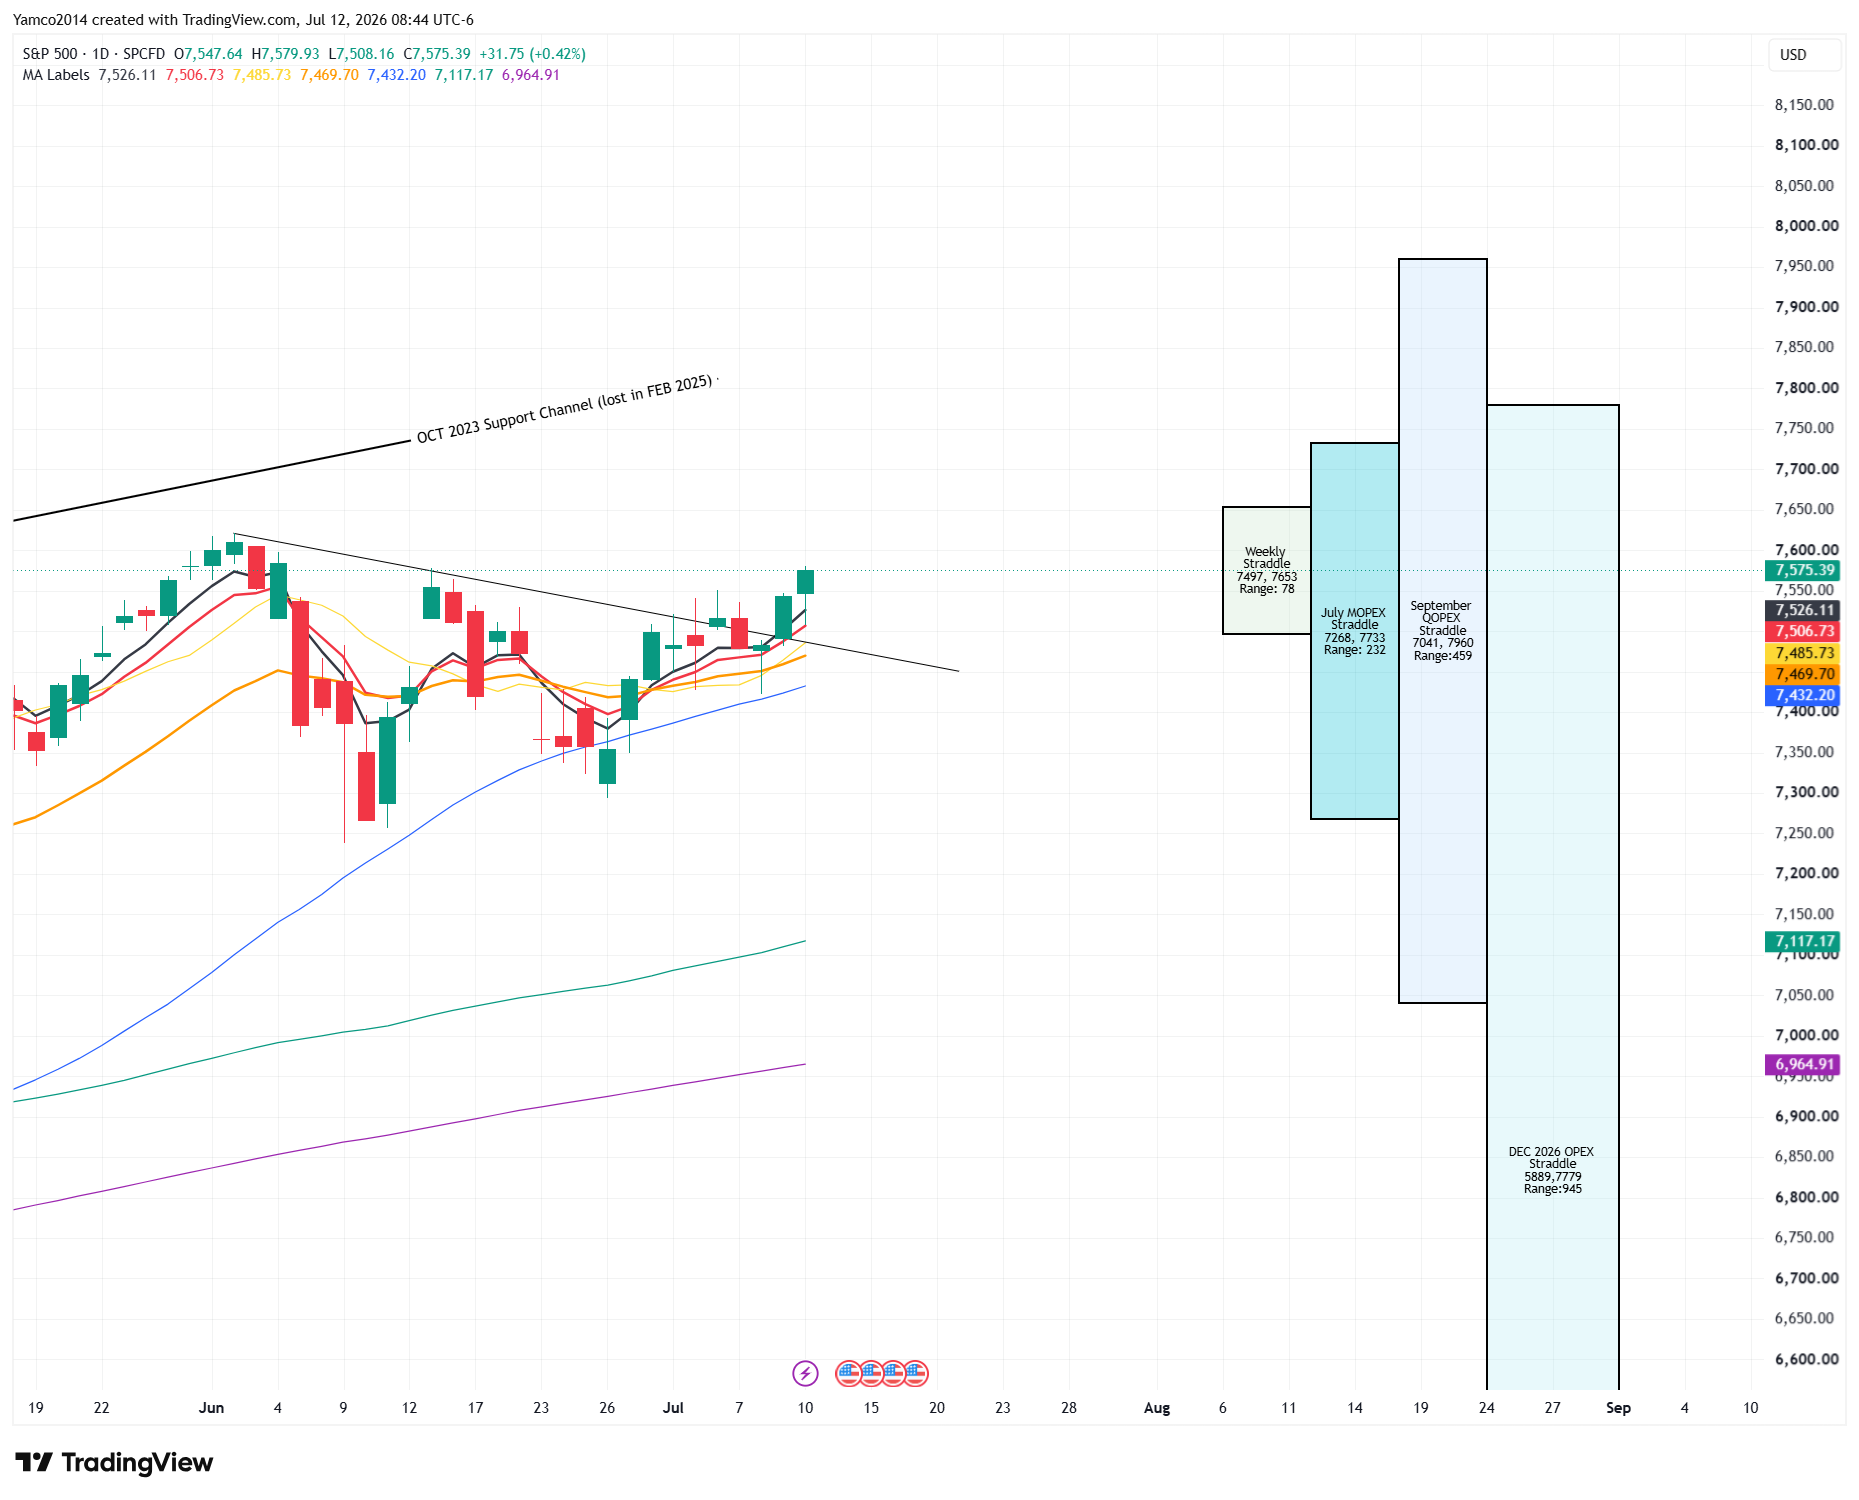
Let’s put some key moving averages on the chart and look at some basic straddle ranges (Weekly,Month end to Month end, Opex to Opex, QOpex to Qopex, DEC OPEX to DEC OPEX).