


Weekly Review and Week Ahead (02-17)

Weekly Review
Starting off with a quick review of the positioning article picture posted over the weekend.
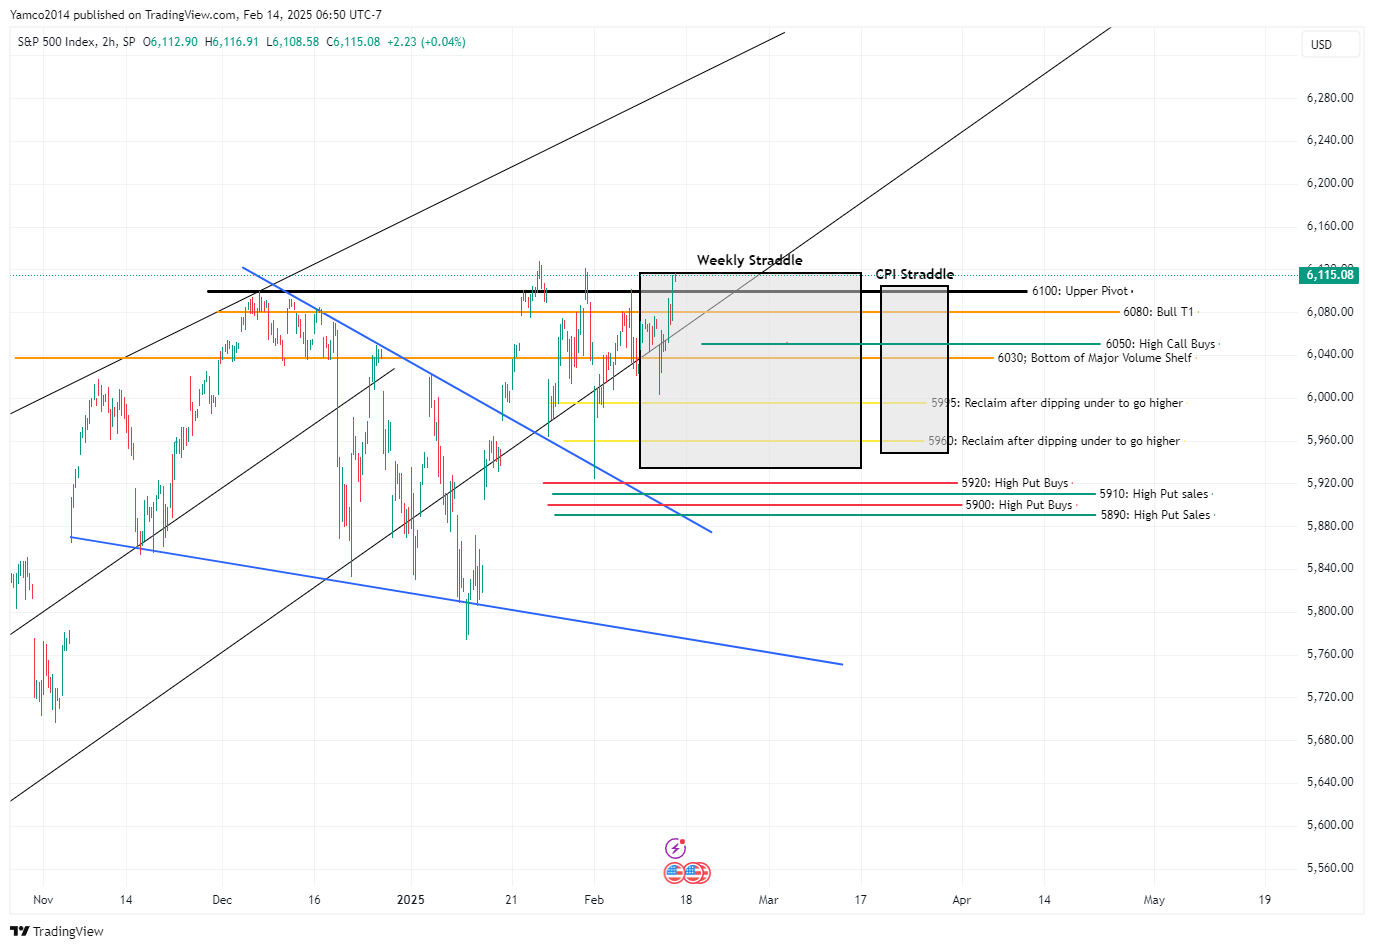
This if the first week in a while where the upper weekly straddle was tested. Not known yet if it’s going to be breached.
For the most part, this whole week (like previous two weeks) has been buy the dip every day or ride the wave up - something we’ve been pretty successful with each and every day on the trades I post.
Notice how the following levels “controlled PA” meaning they were significant inflection points throughout the week
<In no order but from low to high>
5995 - Volume shelf for the last few weeks (was tested on CPI release in premarket) and was the floor for the most part.
6050 - Major call buys for the week - Market set this point as sort of the main pivot and ran higher into back half of the week once we retested it and got above.
6080 - Bull T1 - More or less capped upside until Thursday when it spring boarded above.
6100 - Upper Pivot - 3rd time’s the charm right??? right? in all seriousness, if this holds, we can start moving up after near two whole months of chop between 6100 and 5800.
I posted quite a few SPX trades over the week and will paste a few of the charts with short discussions below.
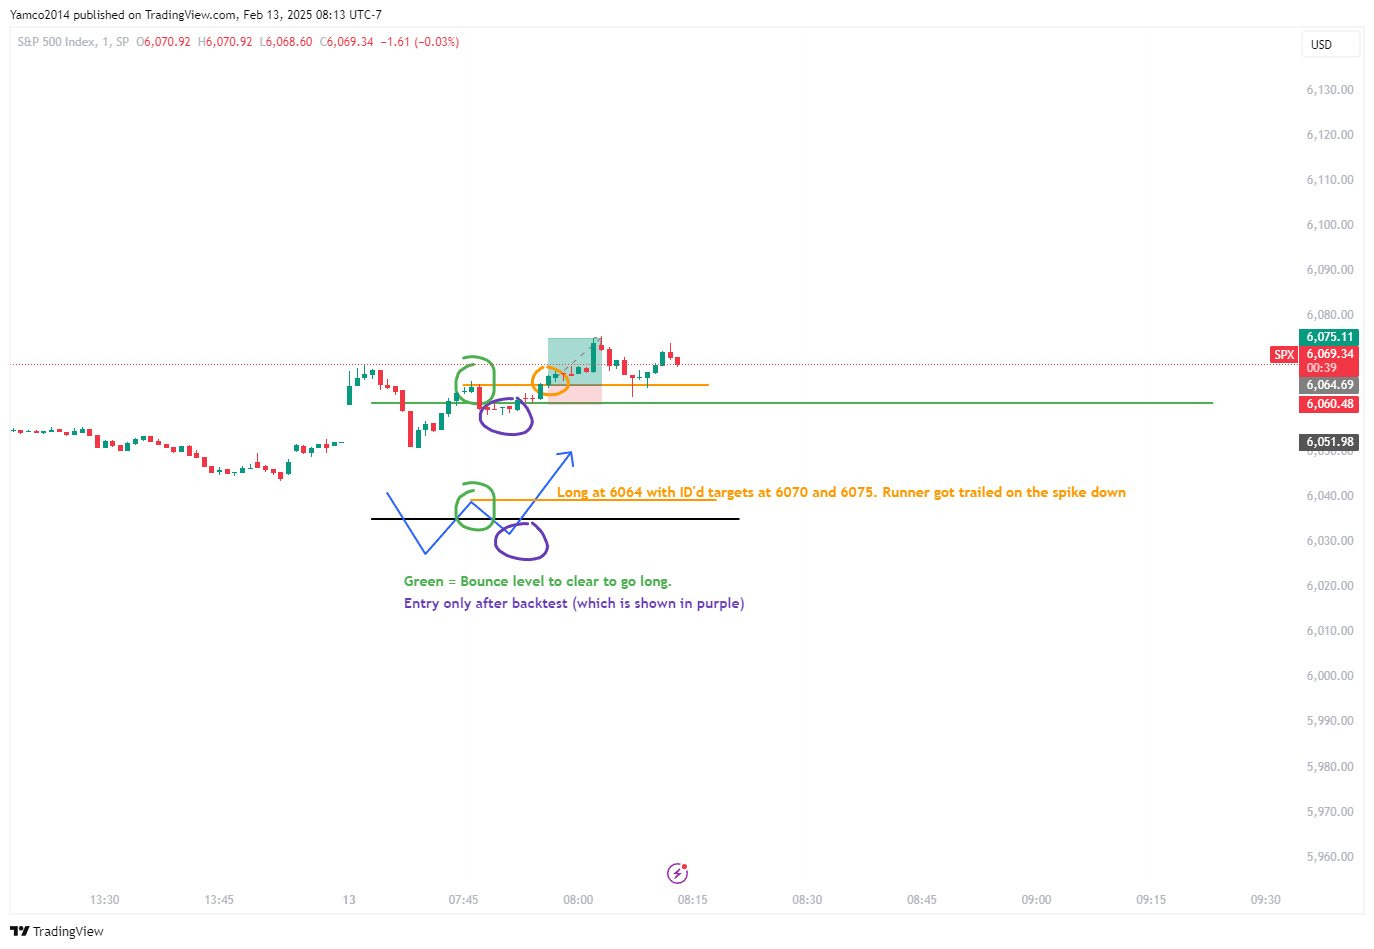
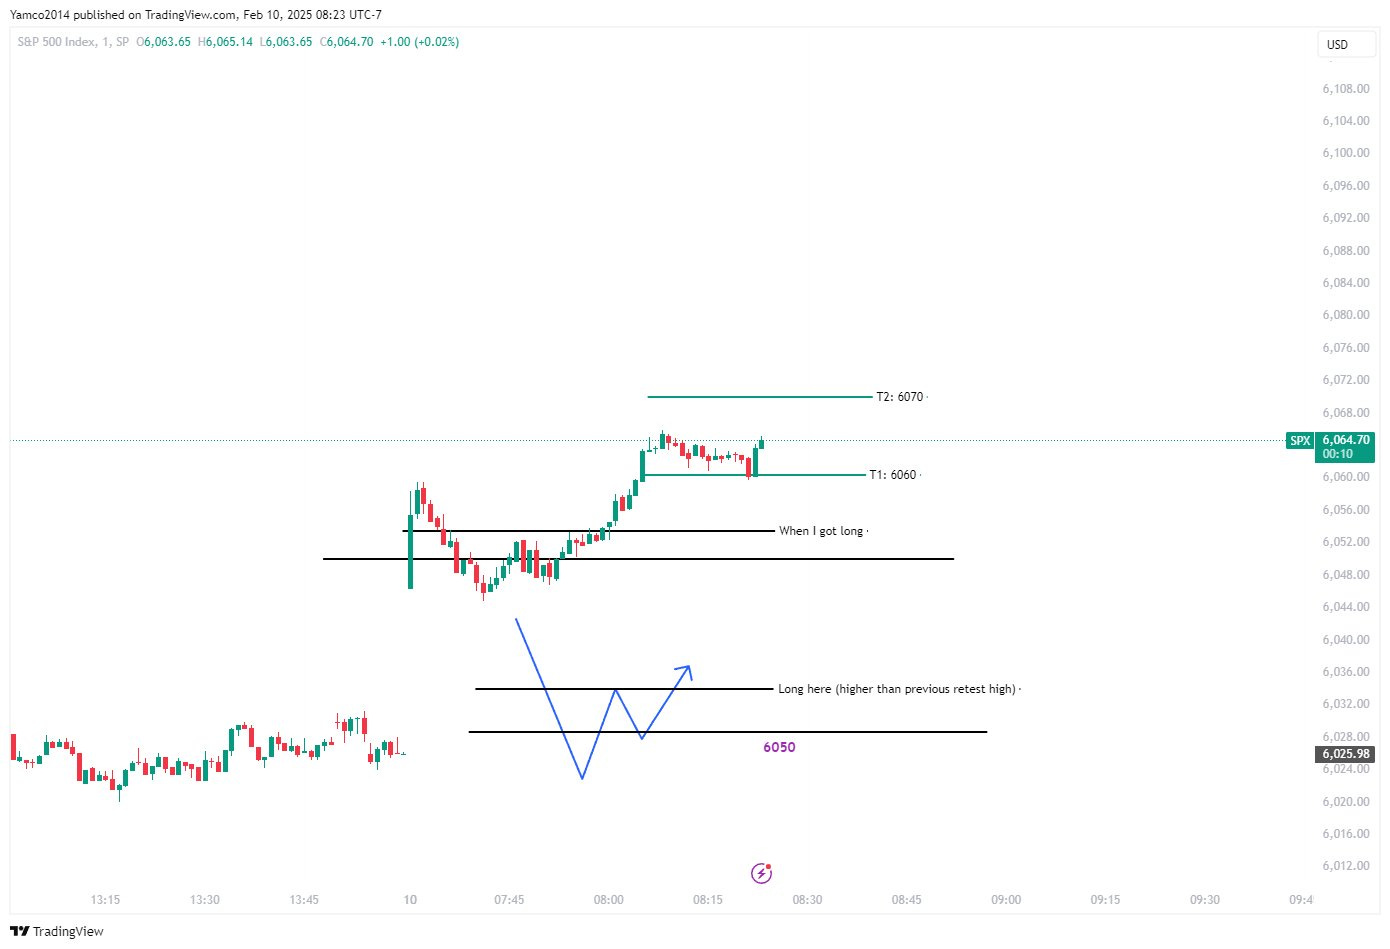
02-13-2025 6060
The general idea drawn in the premarket assumed we came from below to 6060. However, since we more or less opened on it, we had to adjust the plan to get our backtest. This is how the adjustment needed to work (ignore all the lines - They're busy and just something I use to glance at key levels I identify in PM) From the first picture, this is how PA played out. We hit both T1 (6070) and T2 (6075) which were profit taking targets. This trade is now higher than when I exited most of my position but such is life.
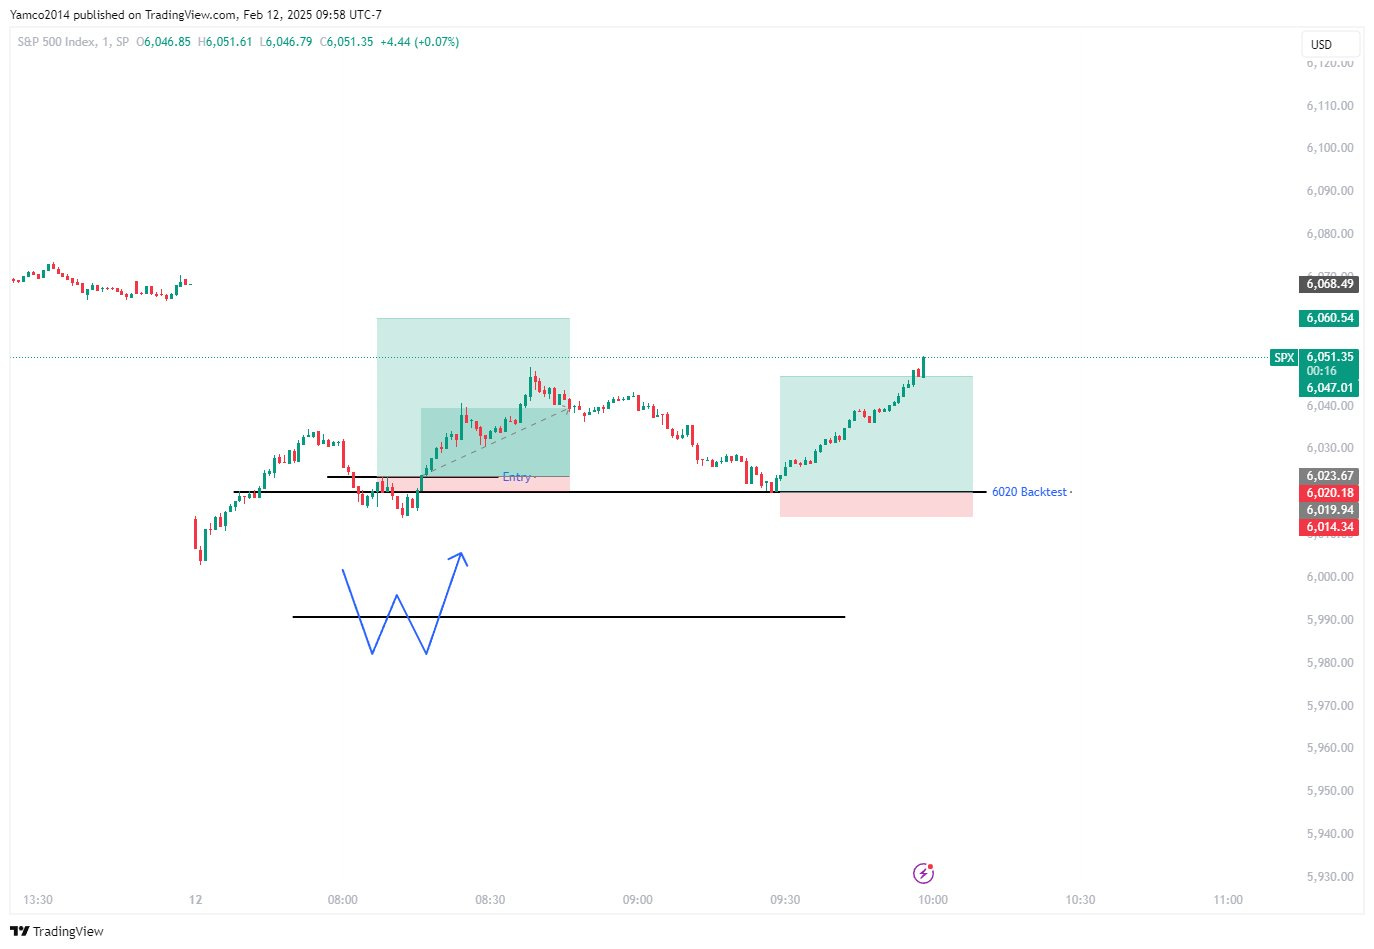
02-12-2025 6020 (2 times)
We started the 12th off looking for a move off 5995 but gapped over it and I adjusted fire in substack chat to look for 6020. It played out perfectly with all targets hit, a sell off and then I said, Look for a bounce off 6020. What more could you ask for?
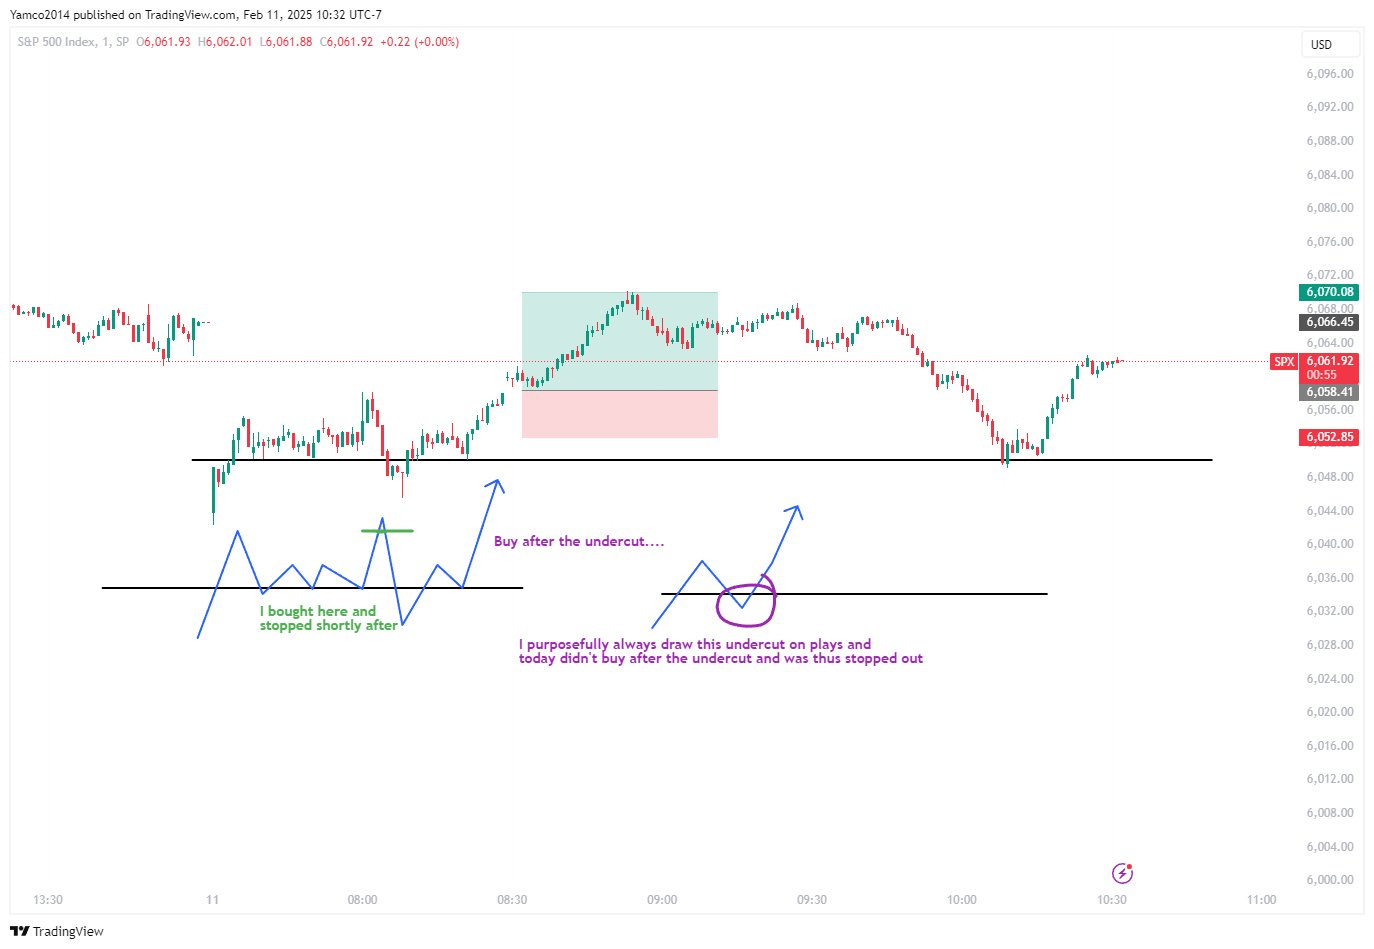
02-11-2025 6050
To be honest, I played this 6050 horribly and got stopped out because I didn’t follow the rules to get the undercut to confirms buyers are truly there. But this was textbook. Above, backtest, and then long above the highest bounce.
Also we got a nice bounce later in the day which I posted about.
02-10-2025 6050 backtest
Simple trade - backtest a key technical level, then go long on highest bounce to hit predefined targets.
Week ahead and outlook
Let’s start with the ES_F chart (by the way my ES BTD chart from last week was a decent bet)
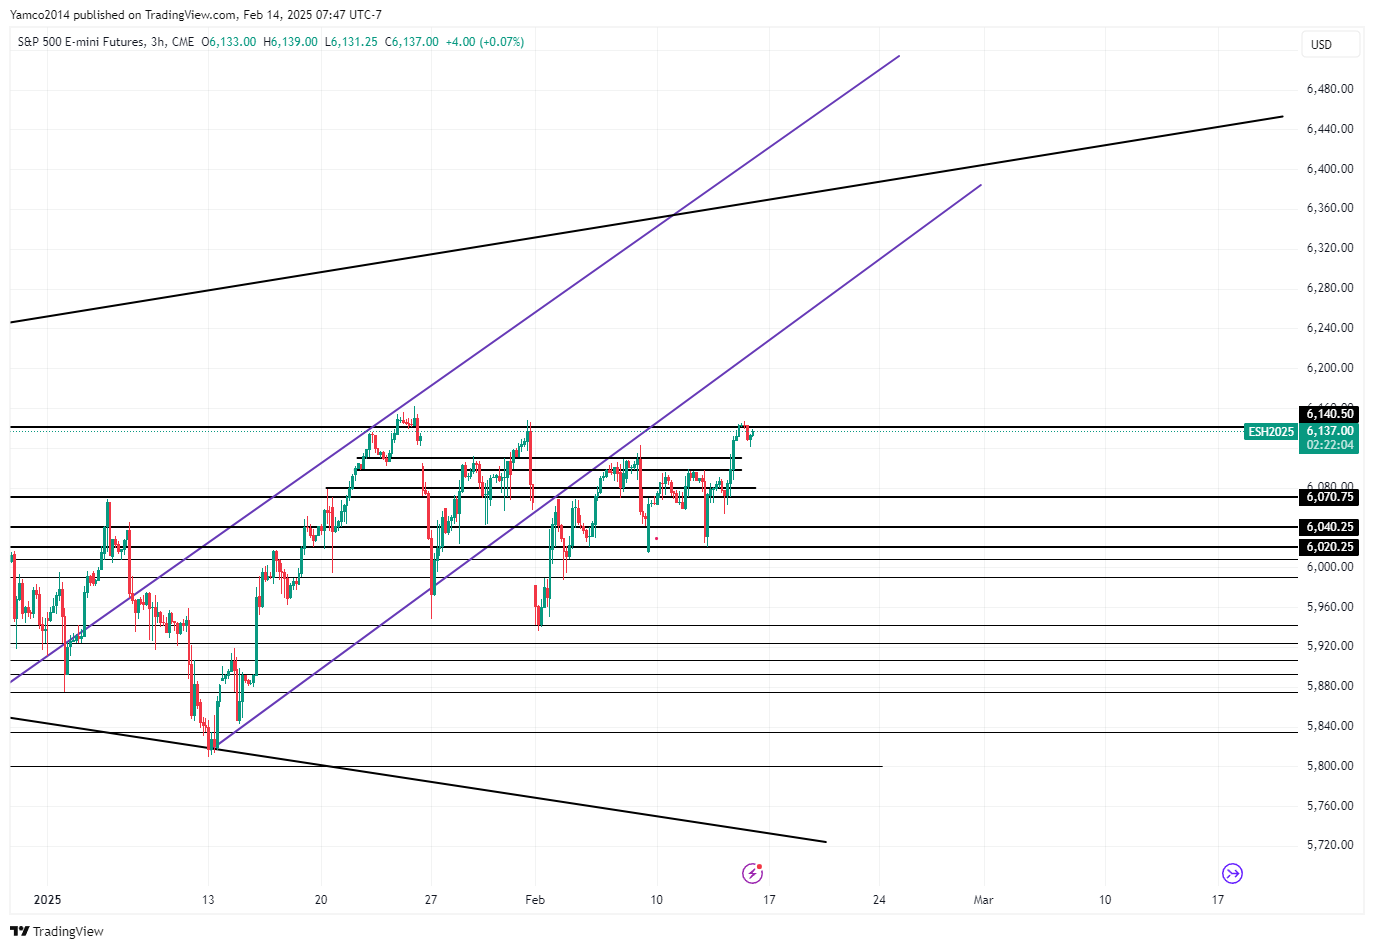
I know it’s busy, but you can see how these lines have been influential in the past PA.
Where do we go from here? No clue, but the BTD crowd has been buying every headline shock for the past 3 weeks so now that we’re back at ATHs…. are we going to get a run to ATHs?? If you assume the bottom purple line is “a target”, that puts us up another 100-125 points which is possible if you look at the gamma surface model below.
I’m looking at the PA and also considering a scenario where single stocks have outsized moves and the indices are more or less flat as well.
One thing that caught my eye is the total put/call ratio (Ticker CPC in Trading View) compared to SPX PA
Total Put Call Ratio to SPX
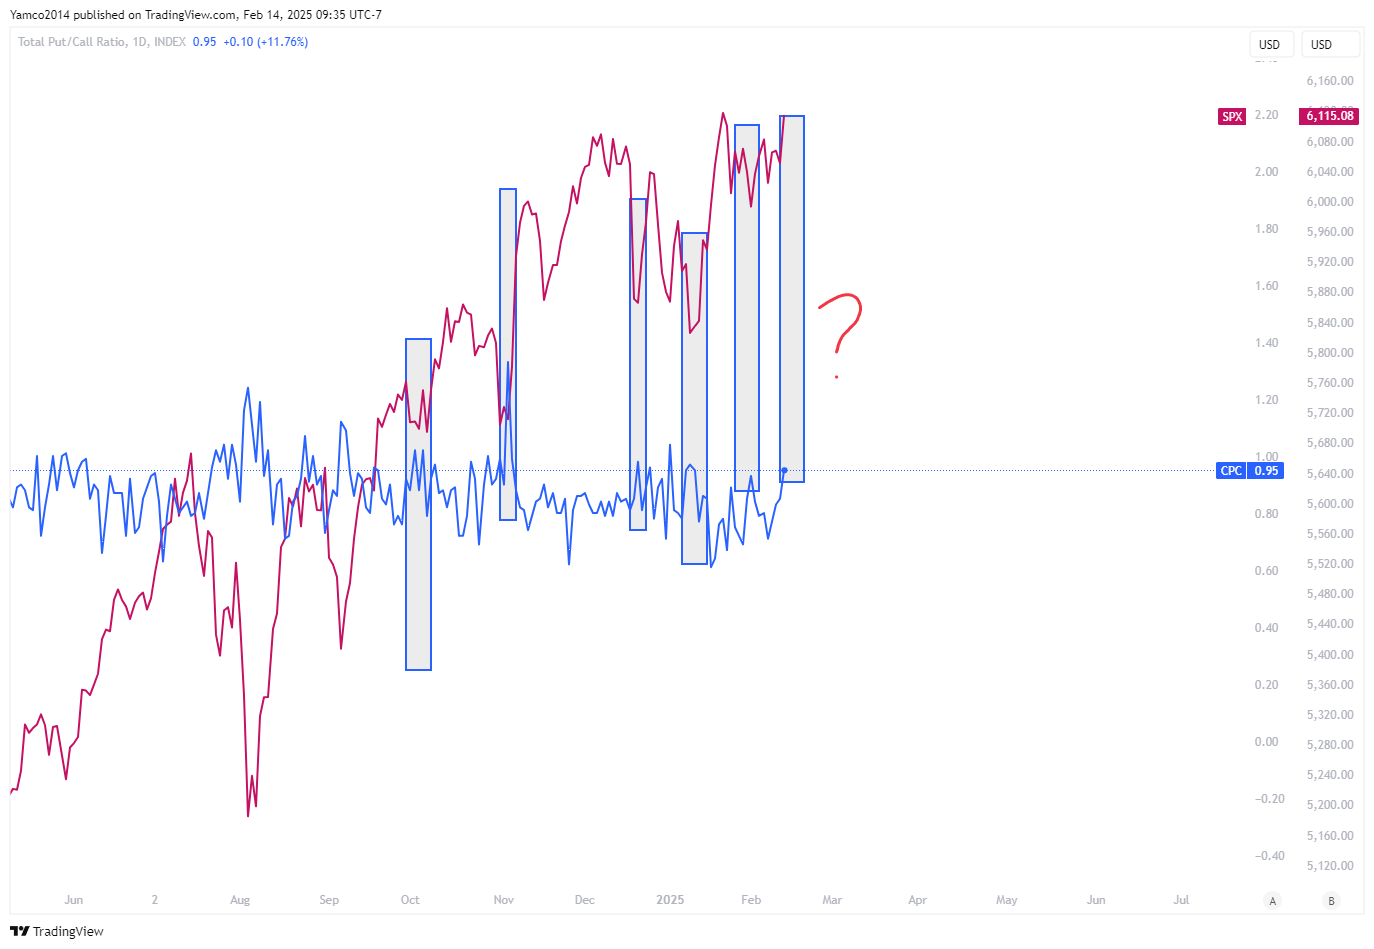
I just Highlighted a few levels where Put call ratio has been near these levels and the market just ripped higher. Will this time be different? I don’t know….
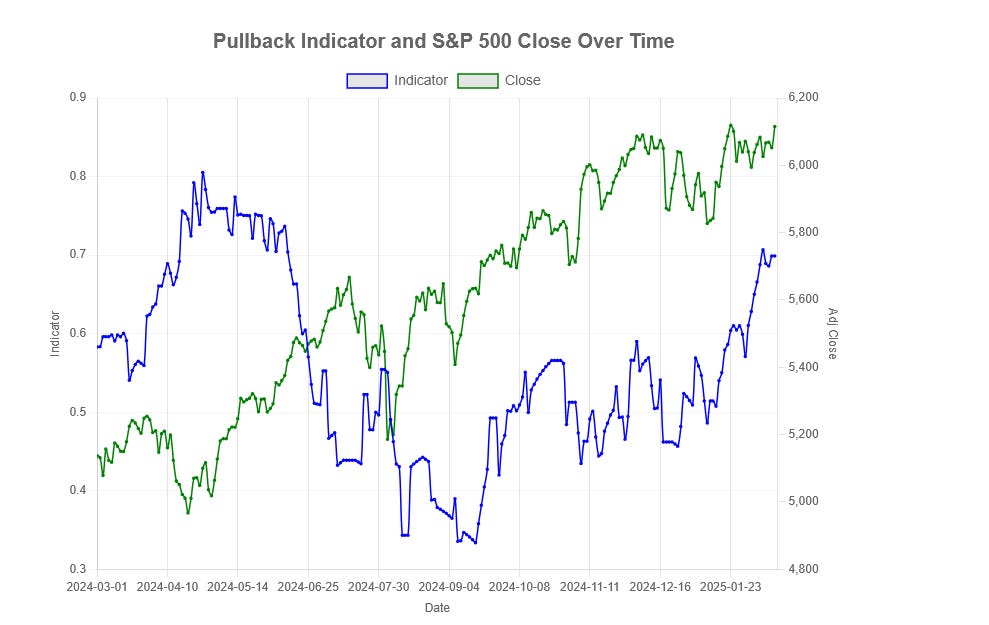
Entropy chart
Entropy has stabilized back near the highs (since April at least)
Quick reminder on what entropy represents
When most people here entropy, they think of disorder/chaos - that's the literaly
lack of order or predictability; gradual decline into disorder.
Entropy was actually used for finding anomalies in EEG readings for cardiac patients. It could detect anomalies (because EEG charts are cyclical) where patients were about to have an imminent heart attack with good accuracy. It comes from the field of signal processing and information theory. It looks for changes in patterns and where a pattern diverges (it doesn't need to be cyclical pattern though...it could be non-cyclical, like an interest rate keeps rising until it blows up the country like Turkish Lira 20 yrs ago). Since, you're a math guy: the math equation is (we use a different variant) -sum[ p(x) log(x)]. <- this is basically, sum up a distribution of finite buckets.
where,
x = the state
p(x) = what proportion of participants are in this state
So, we have a bunch of states - in our case slices of market participants. Some market participants are short a lot, some are long a lot, some are neutral, some are a little short, some are a little long...imagine a spectrum of 10 investors views.
Normal market (each 'state' has a normal or maybe uniform distribution of views) - high entropy, there's no signal as things are going smoothly (i.e., the EEG looks normal, the person is healthy, their heart chart pattern is behaving exactly as it should - no heart attack)
**Distribution of market participant views below**
Normal market
[0.1] [0.1] [0.1] [0.1] [0.1] [0.1] [0.1] [0.1] [0.1]
Abnormal market
[0.7] [0.25] [0.05] [0.0] [0.0] [0.0] [0.0] [0.0] [0.0]
Abnormal market: distribution of states have almost all shifted to one side. In what market scenario does correlation of assets and market views go to 1? The EEG analogy - wow there's a burst in the cardiac chart or wow the amplitude of their readings is much lower than it should be...something is off with their heart. What happens after this is heart attack generally or some physical ailment.
Gamma Surface Model
I like the gamma surface model here which shows you the possibility/potential for how crazy price can get next week.
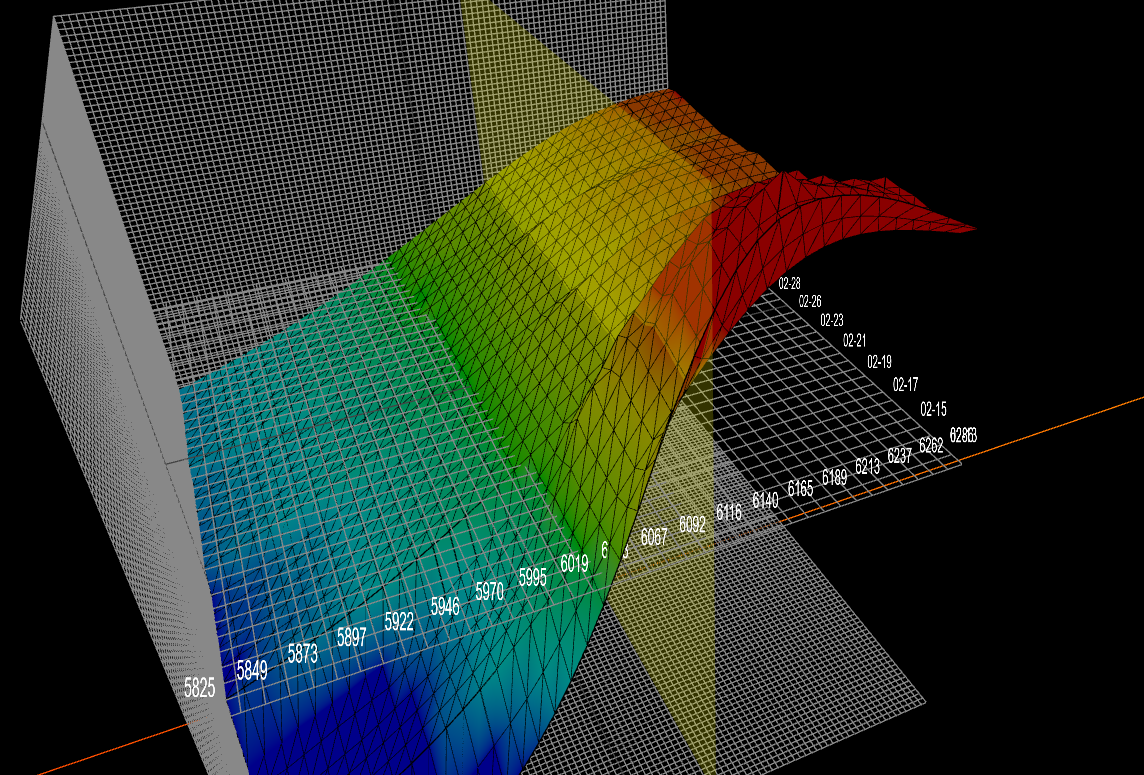
We’re basically looking at the gamma concentrations over time/price and how crazy a squeeze COULD get if the market were to continue up… This is not predictive. This is merely a representation of positioning over time.
At the end of the day, I think any dips that stay > 6080 or quickly recover are constructive and the market is going to move in a manner that causes the most pain to the most participants.
Economic events next week
Wednesday 2-19
British CPI (O/N)
US housing starts (BMO)
GDPnow (Q1) (830 EST)
FOMC Minutes (1400)
Thursday 2-20
Phlly Fed manufacturing (830 EST)
Weekly Jobless Claims (830 EST)
Friday 2-21
Global PMIs (945-10 EST)
Keep reading with a 7-day free trial
Subscribe to Yamco to keep reading this post and get 7 days of free access to the full post archives.