
Where's the Volatility: Round 2

Well.. It’s time we revisit this series.

This article was published on the morning of 10/9….
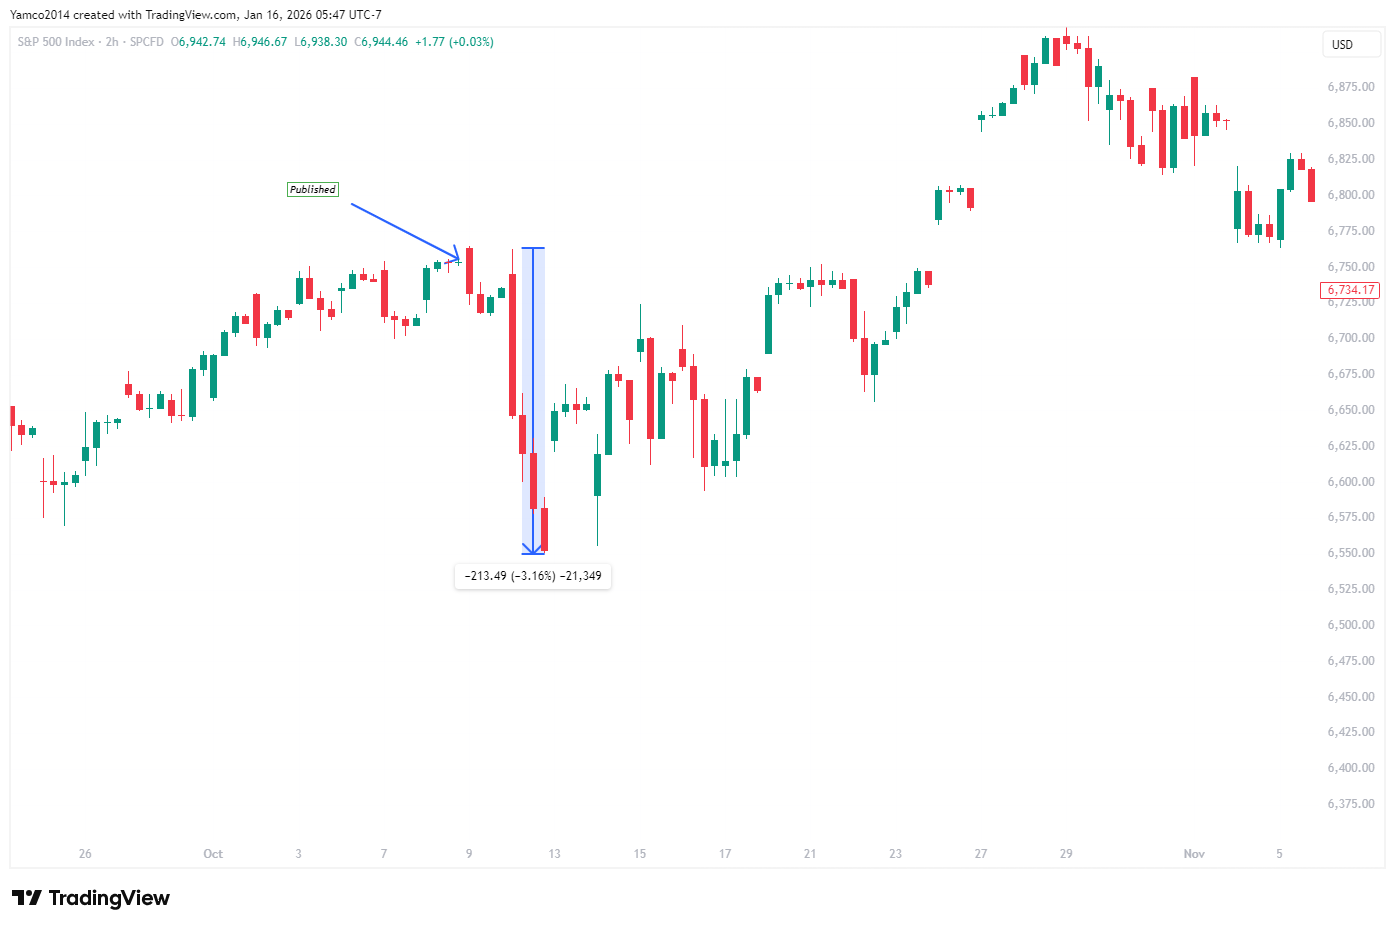
We saw a 3% move down the next day - This original article explored a view that the “RV Spring” was pushed down too much. - Let’s dive into the backdrop that makes the next few days interesting to watch.
Let’s Dive into Realized Volatility
Quick Refresher: 1M trailing RV
-Simply the standard deviation of the closes for the past 21 days. I drew the pink line here.
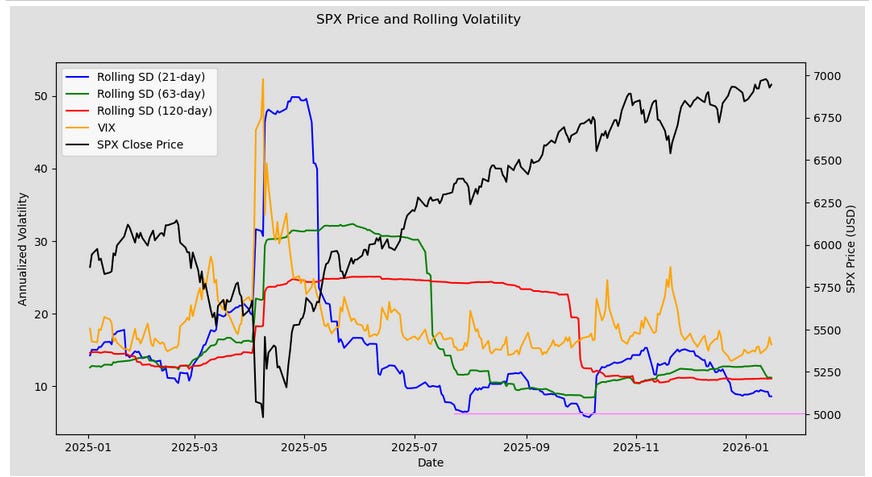
In the next 4-7 days, it’s possible we eclipse this line in its entirety and go to a record low of RV - It’s too early to give you an exact date or an exact prediction. Bottom line, there’s ALOT of RV rolling off in the next 4 days.
As of current calculations (This is a rolling metric)
26.8% rolls off on 01/20
8.5% rolls off on 01/21
10.7% rolls off on 01/22
The numbers above are variances that roll off as of today’s RV so the path matters
All of that to say, we’re approaching the level where something can happen.
In case you look at the above, and say… Well there’s only two data points….Let’s go back to 2021…..
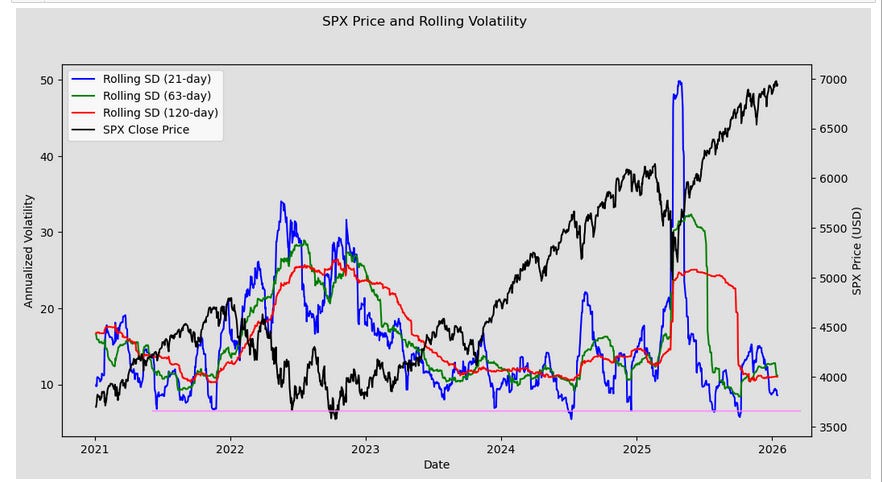
I’m drawing a line on a few points and going to expand the criteria in the table below.
Below are the dates and when we trigger the down move (Market days later)
06/15/2021 ~ 3 days ~ 2% move [7.31% RV]
09/02/2021 ~ 11 days ~ 5% move [7.99% RV]
11/152021 ~ 10 days ~ 4.37% move [6.75% RV]
08/01/2023 ~ 14 days ~ 5.3% move [7.99% RV]
12/19/2023 ~1 day ~ 1.6% move [7.06% RV]
7/18/2024 ~ 10 days ~ 4.36% move on break (multi-day) [7.07% RV]
12/6/2024 ~ 6 days ~ 3.8% move on break (single day) [7.67% RV - went down to 6.54%]
7/28/2025 ~ 6 days ~ 2.38% move on break (close ~ more intraday) [6.4% RV]
10/1/2025 ~ 7 days ~ 2.79% move on break (close ~ highest at close) [6.4% RV]
We can break 7% after Monday’s close and if it continues, get a 5 year low on 1M Trailing RV by EOM - remember this is path dependent.
Additional views
The below is some graphics from Nomura (Charlie McElligot) from 01/13
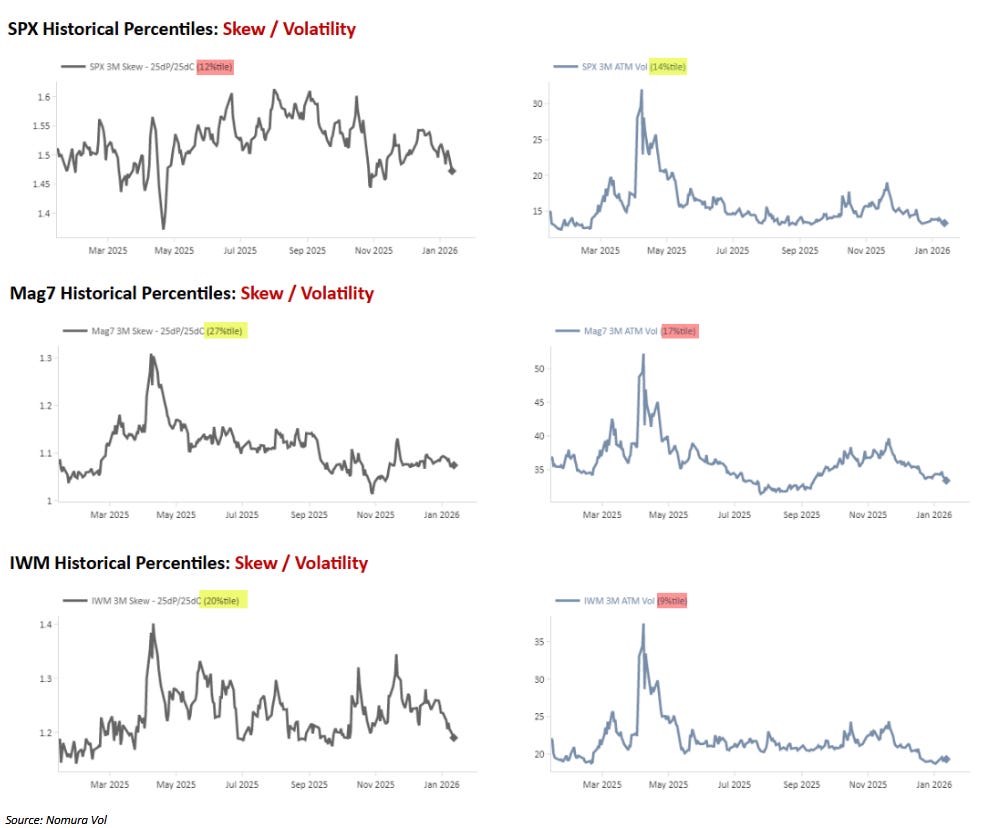
These graphics are just showing that the index put skew is approaching relative low levels for the past year. The notable thing is IWM 0.00%↑ is full bull with only the FEB-April sample lower so you can splice that section out and even say that we’re nearing the 0 percentile….
The below is from 01/07
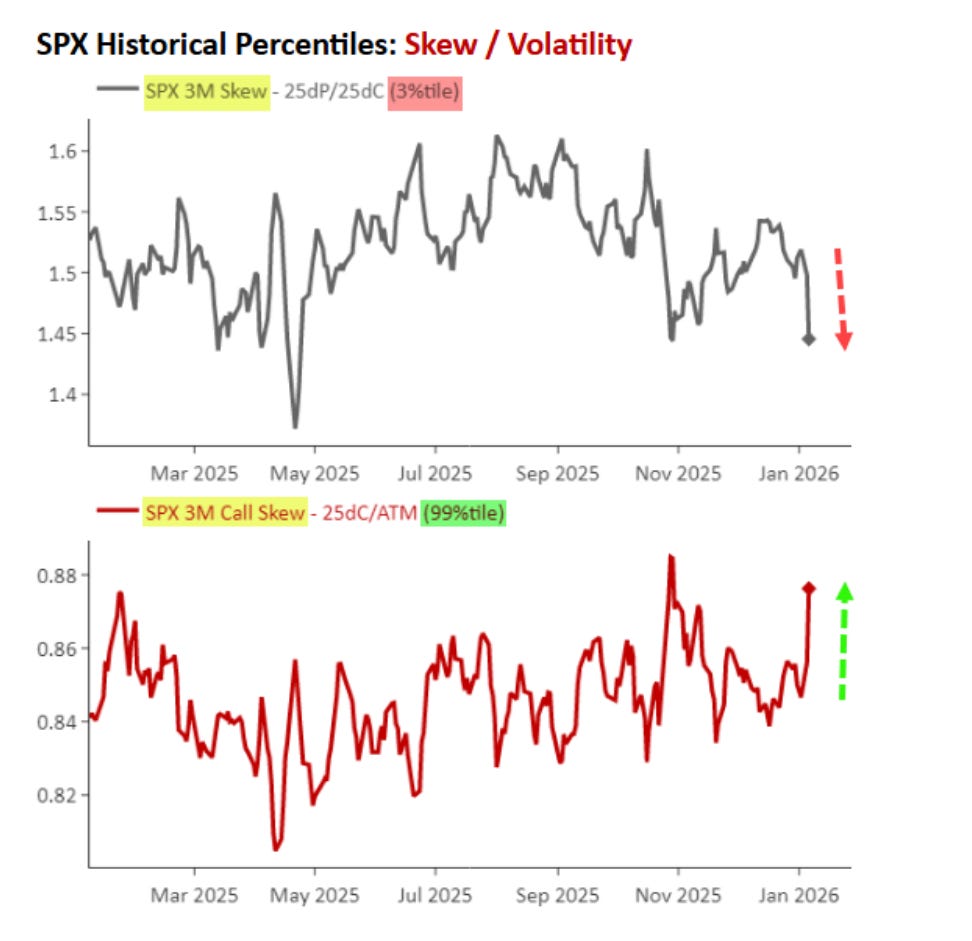
The last time we saw call skew go a little nutty was before 10/10 (Go check the article)
Final point from (01/07) - This is the VIX futures positioning) - Record short positioning on VIX futures.
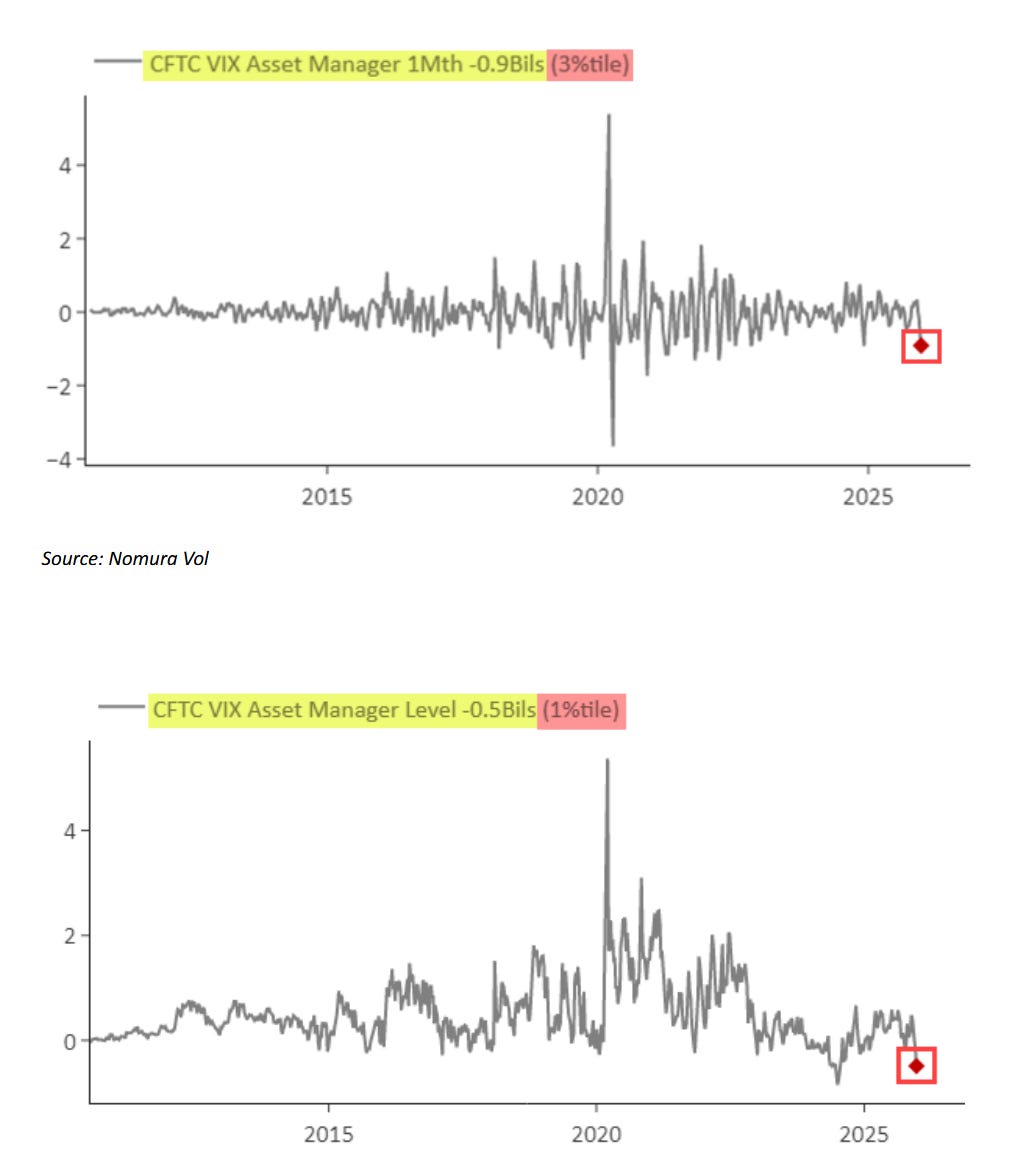
Surely…. record VIX short positioning can’t be the best positioning as we track a bit of exuberance.
Let’s look at some market sentiment/positioning data
NAAIM Exposure
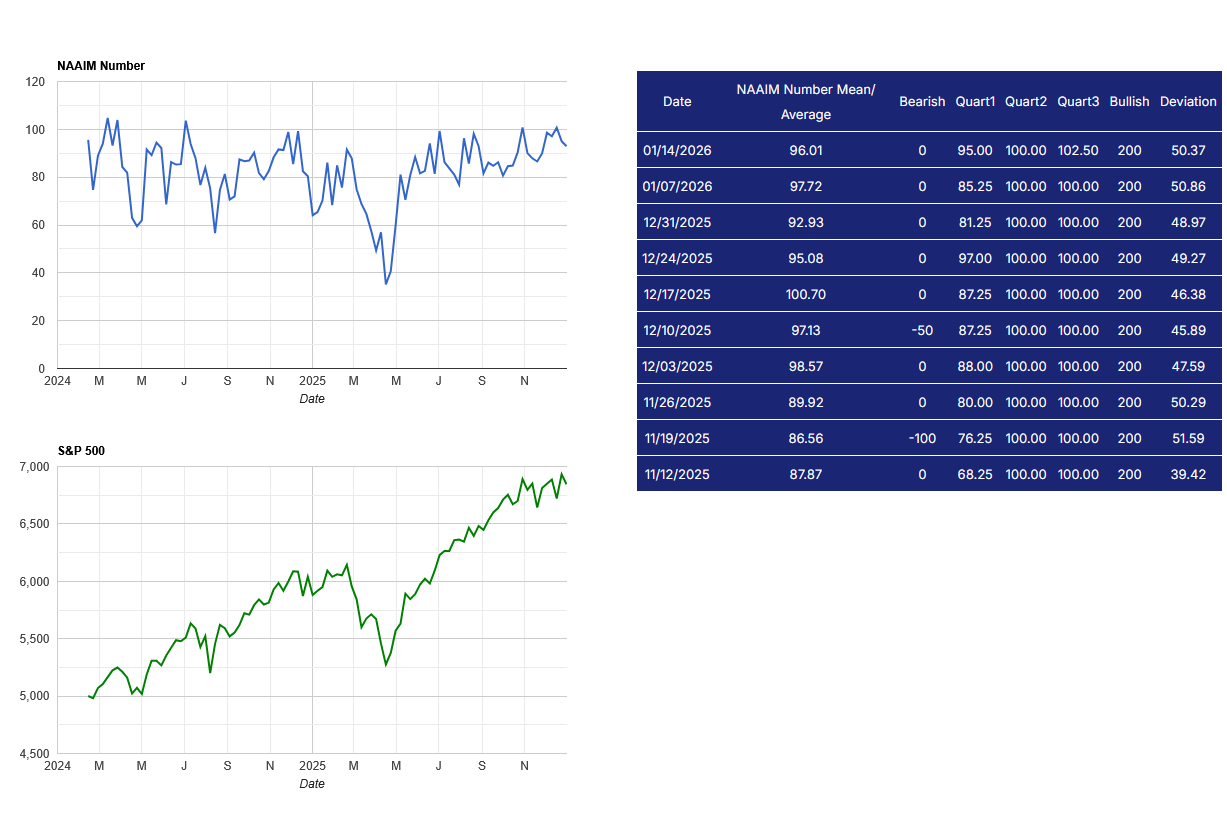
7 weeks of relative max exposure by managed funds. Key takeaway is where is the additional juice here?
AAII Sentiment
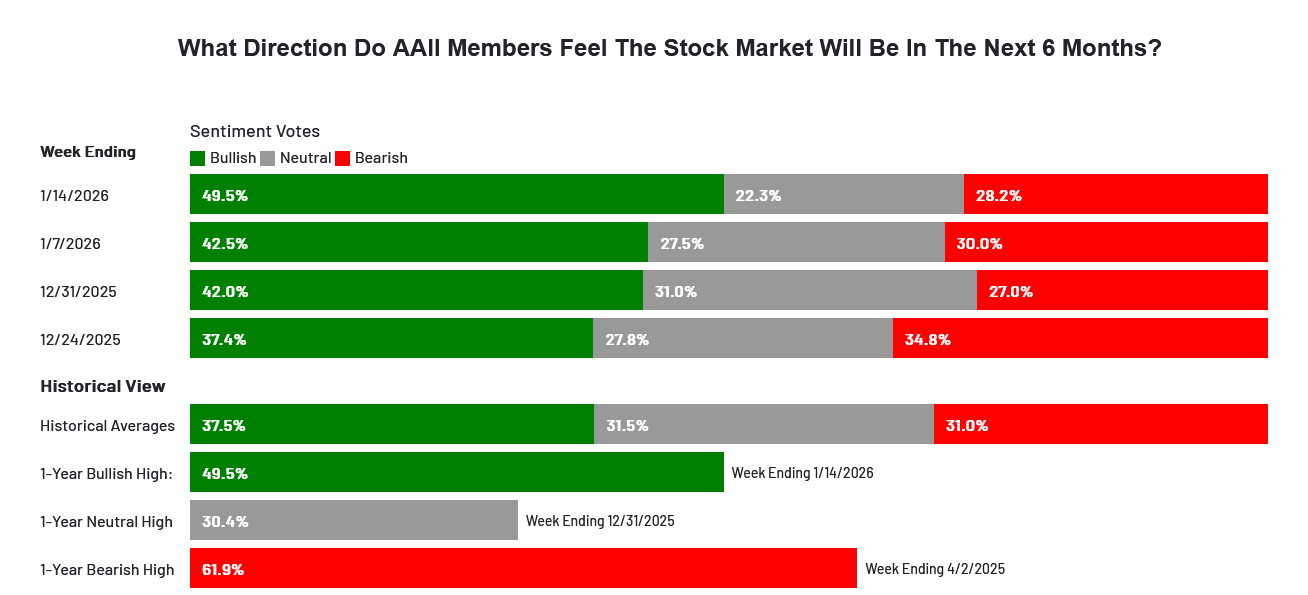
We’re full bull as of yesterday. Here’s a few other dates we got full bull in the past few months
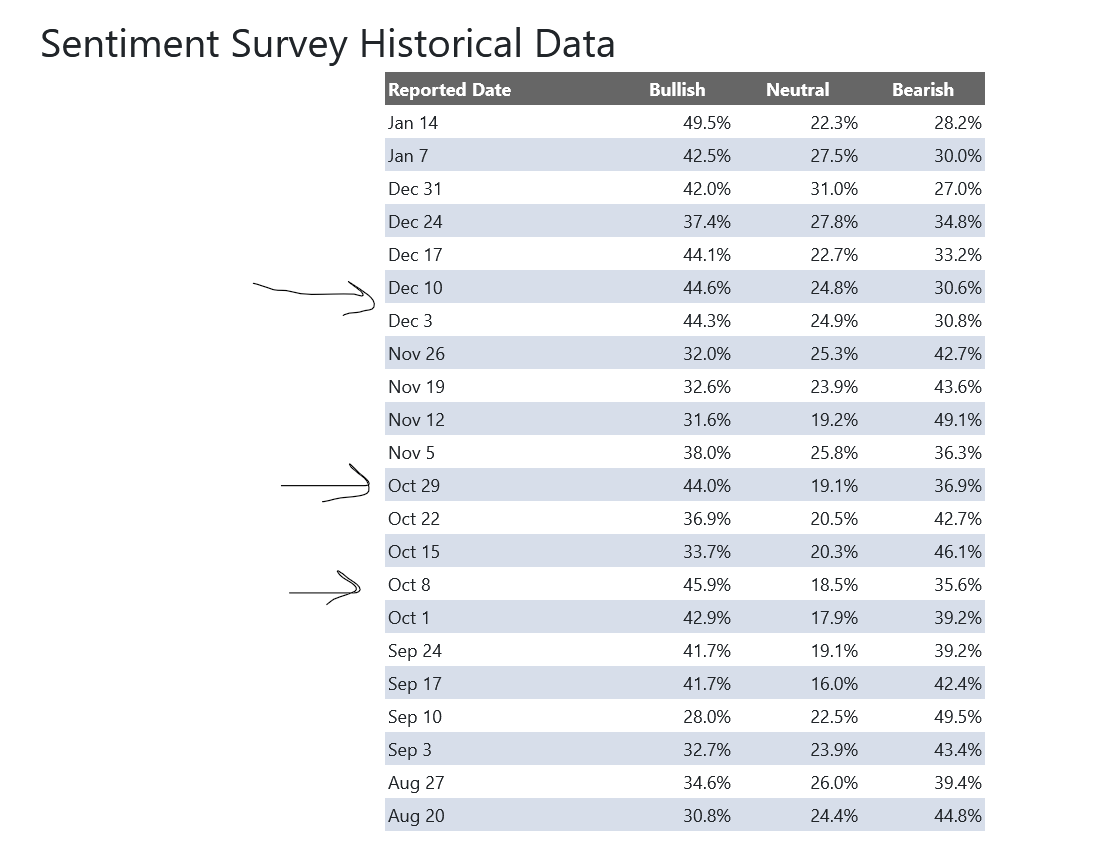
Go glance at SPX on these dates….
Volatility Positioning
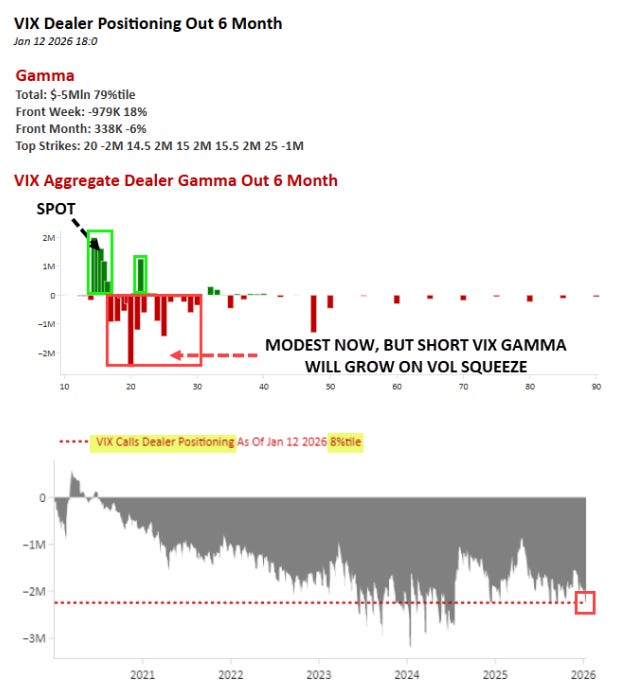
VIX over 18 and there’s room to see quite a spike into upper 20s or 30s
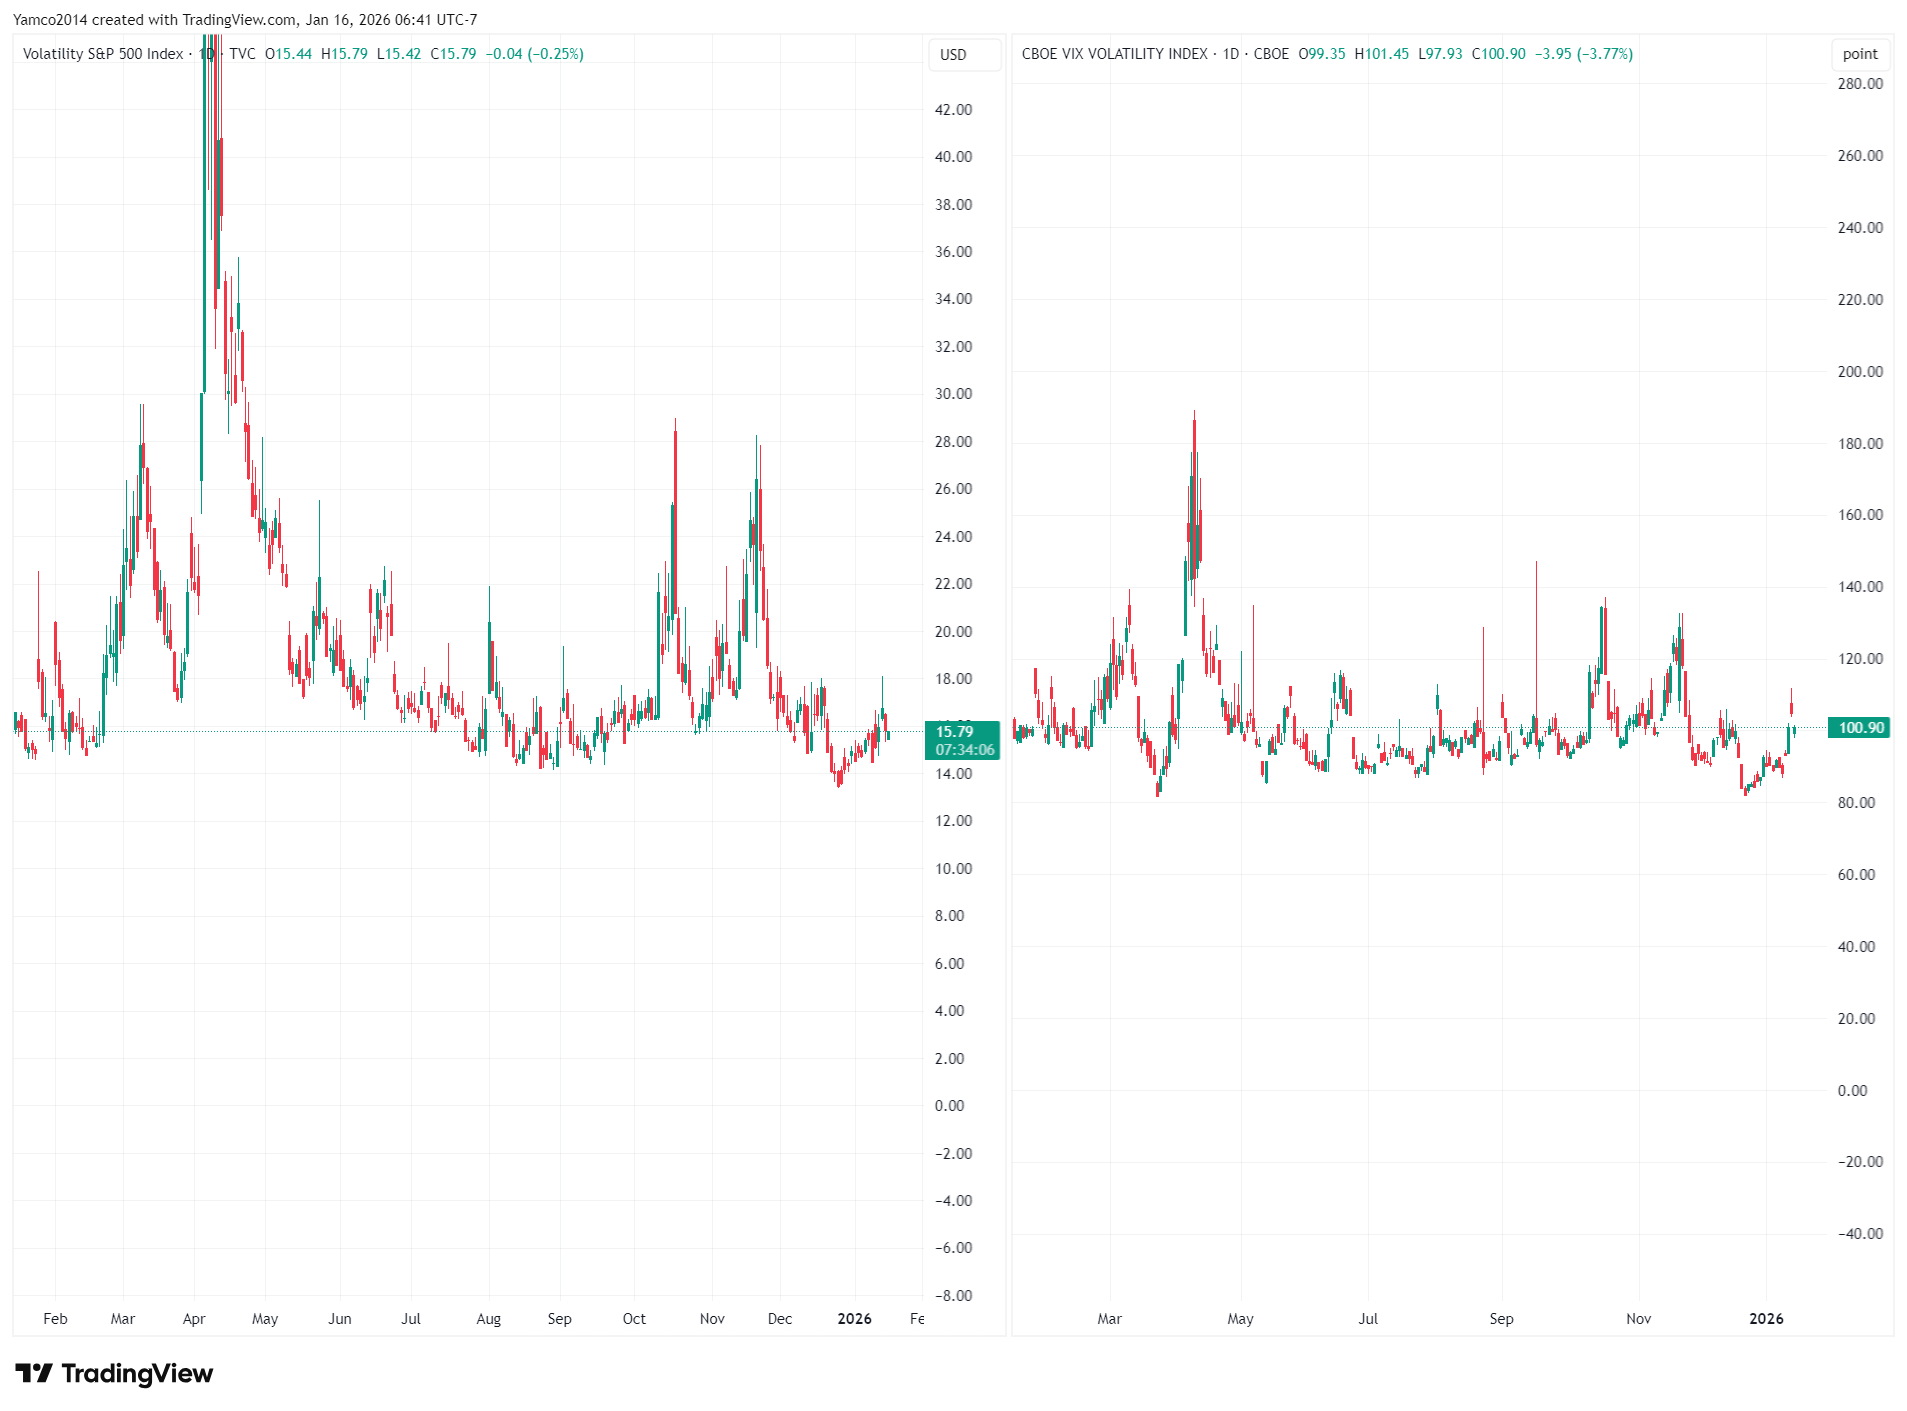
Let’s examine VIX and VVIX side by side (see above) - VIX near the lows while VVIX is actually lifted a bit. The takeaway here is the VIX short is primarily in futures and hedged with VIX calls.
All of this to say…. I’m going to be early here but I think it’s time to add some March hedges. I’m working on some additional analysis to ascertain which delta option benefited the most during each of the RV periods detailed above. Please don’t go crazy with hedges - Just because something has happened historically when these metrics align, doesn’t mean it happens again.
I leave you with this thought… consider taking off short term leverage - I’m not making changes to my longer term holdings - I have ample cash holdings but will enter some hedges now and add another smaller tranche towards the end of next week.
After all, it if walks like a duck, quacks like a duck… it must be a hawk?
This is simply awesome analysis @yamco