


Positioning and Week Ahead [06-23]

Weekly Review was published separately here:

Looking into next week, we have several big events (taken from Investing.com) while the main headline event continues to be Iran/Israel… Tariffs and the tax bill remain an ongoing issue and aren’t really being talked about.
FWIW, Japan scrapped the latest trade discussion deal on Friday because the US demanded more defense spending - Japan was supposed to be the easy one to close…. I’m sure all of this is TACO’d and people forget and move onto the next hot topic issue.
Monday
EUR/UK PMIs (Overnight)
S&P Global PMIs (0945)
US Home Sales (1000)
Bowman speaks (1000
Willians Speaks (1430)
Tuesday
CB Consumer Confidence (1000)
Powell Speaks (1000)
2 Year Note Auction (1200)
Williams Speaks (1230)
API weekly Crude Oil Stocks (1630)
Wednesday [Touch Grass]
Building Permits (083)
New Home Sales (1000)
Powell Speaks (1000)
5 Year Note Auction (1200)
Thursday
Durable Goods Orders// Jobless Claims (0830)
7 Year Note Auction (1200)
Friday
UK GDP (0200)
PCE//Core PCE (0830)
Consumer Sentiment (1000)
Bank Stress Test Results (1630)
How significant are these events?
Well, we can use the straddle pricing to see the general jumps in pricing. See below
Positioning into the next week
I’ll go over each topic and summarize how I bring all this together at the end.
If you have any questions on these topics, check out the positioning article linked below

I added some general explanations of my scanner to the Review of Positioning Metrics (Keeping everything in one place)
Topics covered
Straddles with 50/70 percent ranges
15/25/40 Delta Skew by Date
Term Structure
Net positioning (Aggregate and by day)
Technical Structure of the Market
Key zones to watch
Putting it all together
Straddles with 50/70 percent ranges
There’s a few different straddles going to be shown.
First, let’s look at next week’s straddle (and I included Monday 06/30)

The straddle for this next week is 101.7 points giving us a range of [5866,6085.5] with EOM just 13pts higher for the range of [5853,6098].
The 2nd set of Straddle information to keep track of is for the next OPEX [July 18th] and next quarterly OPEX [09-19]

July OPEX Straddle Range = [5755,6180]
SEP OPEX Straddle range = [5576,6360]
The 25 delta puts are priced about 25% higher for the majority of the week
If you’re curious how I came to that conclusion, the inner blue/yellow numbers are the 25 delta ranges while the outer blue and yellow numbers (additive to the inner) represent the 15 delta ranges.
The 70% Range for each day(or week) can be obtained by adding the two yellow and two blue numbers together and adding the yellow sum to the spot price to get upside range while adding the blue sum to the spot price to get downside range.
Quick example (for this week)…

Let’s compare the 70% range derived from the 15 deltas to the straddle…
70% range: [5798,6076]
Straddle: [5853,6098]
Notice the disparity and how much more puts are being price than calls for the week?
Using Friday PM’s Values, you can see the downside ranged priced in is 51 pts higher than upside range.
Skew

Orientation of charts
15 delta = top (OTM) and is often the place for speculative upside/downside. It’s a bit wingy but not quite as wingy as a 5 delta.
25 delta = middle (slightly less OTM) and is often the relative delta for hedges
40 delta = slightly out of the money and is often the relative delta for directional moves
Orientation of data in charts
Gray = ATM volatility (general demand in volatility)
Yellow = Call volatility
Blue = Blue volatility
Red = Skew
Observations
ATM volatility climbs steadily throughout the week and the 15/25 delta skew for the 25 “hedge” delta and 15 “speculative delta” increase into PCE on Friday. Interestingly enough, the 40 delta or “directional” skew appears to fall (marginally).
Term Structure

Term structure (as of Friday close) is now back in the mid range of the past 15 days and rises into the first full week of July. For what it’s worth - that’s the 90 day Tariff pause date. Again … don’t see a need to panic because I’m sure there will be goal post movement and a declaration of victory!
This shouldn’t be a surprise to anyone as the middle east heats up yet again. If this event vol comes off, there’s a strong chance we get a snap back rally. On the flip side - As long as volatility remains elevated, the daily ranges will remain elevated.
Net positioning (Aggregate and by day)
Aggregate

This next week boasts an environment with slightly higher put exposure.. This is a simple OI view but wanted to show the magnitude of options positioning and how it’s distributed.
From left to right
OI - Simple OI from Friday morning (just to show magnitude of positioning).
Volm_BS - Today’s volume aggregated by buy/sell
Orientation
Blue = Put
Yellow = Call
Above X Axis = Net Bought
Below X Axis = Net Sold
Volm - Today’s aggregate total volume
This next week is dictated by headlines and EOM/EOQ on Monday but for now I’d imagine, barring a resolution to one of many hot topics, upside is generally capped at 6050 and a bit of downside expansion happens this week.
Note this graphic is a net positioning heat map for the entire week

Monday looks like it is very well hedged and/or looking for downside range expansion. We closed ~ 5965 and much of Monday’s positioning (See below) is very OTM.

The only other call out I want to make is Friday 6/27 as the rest of the week generally looks undeveloped for now. Friday is dominated by this 50W Put Butterfly centered on 5905. This was bought this week and I mentioned it on twitter and in chat several times. At the time I flagged it, it was trading at $4.30 so let’s see how it ends up. The reason I highlight this very specific trade is 5905 is the JPM short call collar on Monday.

Technical Aspects of the Market
Before I cover key zones to watch, let’s look at some technical aspects of the market.
S&P Stocks above 200D average (S5TH)

Current reading is 45.12down slightly from 47.4 and 49.2 which are the two values for the preceding weeks respectively. This is generally in the lower mid point of the range for the past ~2 years.
S&P Stocks above 50D average (SF5I)

Current readings is 63.81 which has fallen from last week’s reading of 70.43 and reading of 72.61 from two week’s ago. This metric shows a large portion of the market is above the 50D [This metric covers the V recovery so will remain elevated for quite a bit longer even if the market consolidates undergoes a slight correction.
S&P Stocks above 20D average (S5TW)

Current reading is 46 up from last week’s reading of 40 and the previous week’s reading of 61. This technical indicator has issues akin to the above (S5FI) due to timing (past month ~ a month has about 22 trading days) and what has happened over the 20 trading days but I believe it will start to represent the market’s internal structure in the next week or two.
S&P Stocks above 5D average (S5FD)

This short term momentum indicator is currently at ~43.93. There’s some large volatility at play as this is essentially a rolling weekly metric capturing momentum.
Total Put/Call Ratio (CPC)
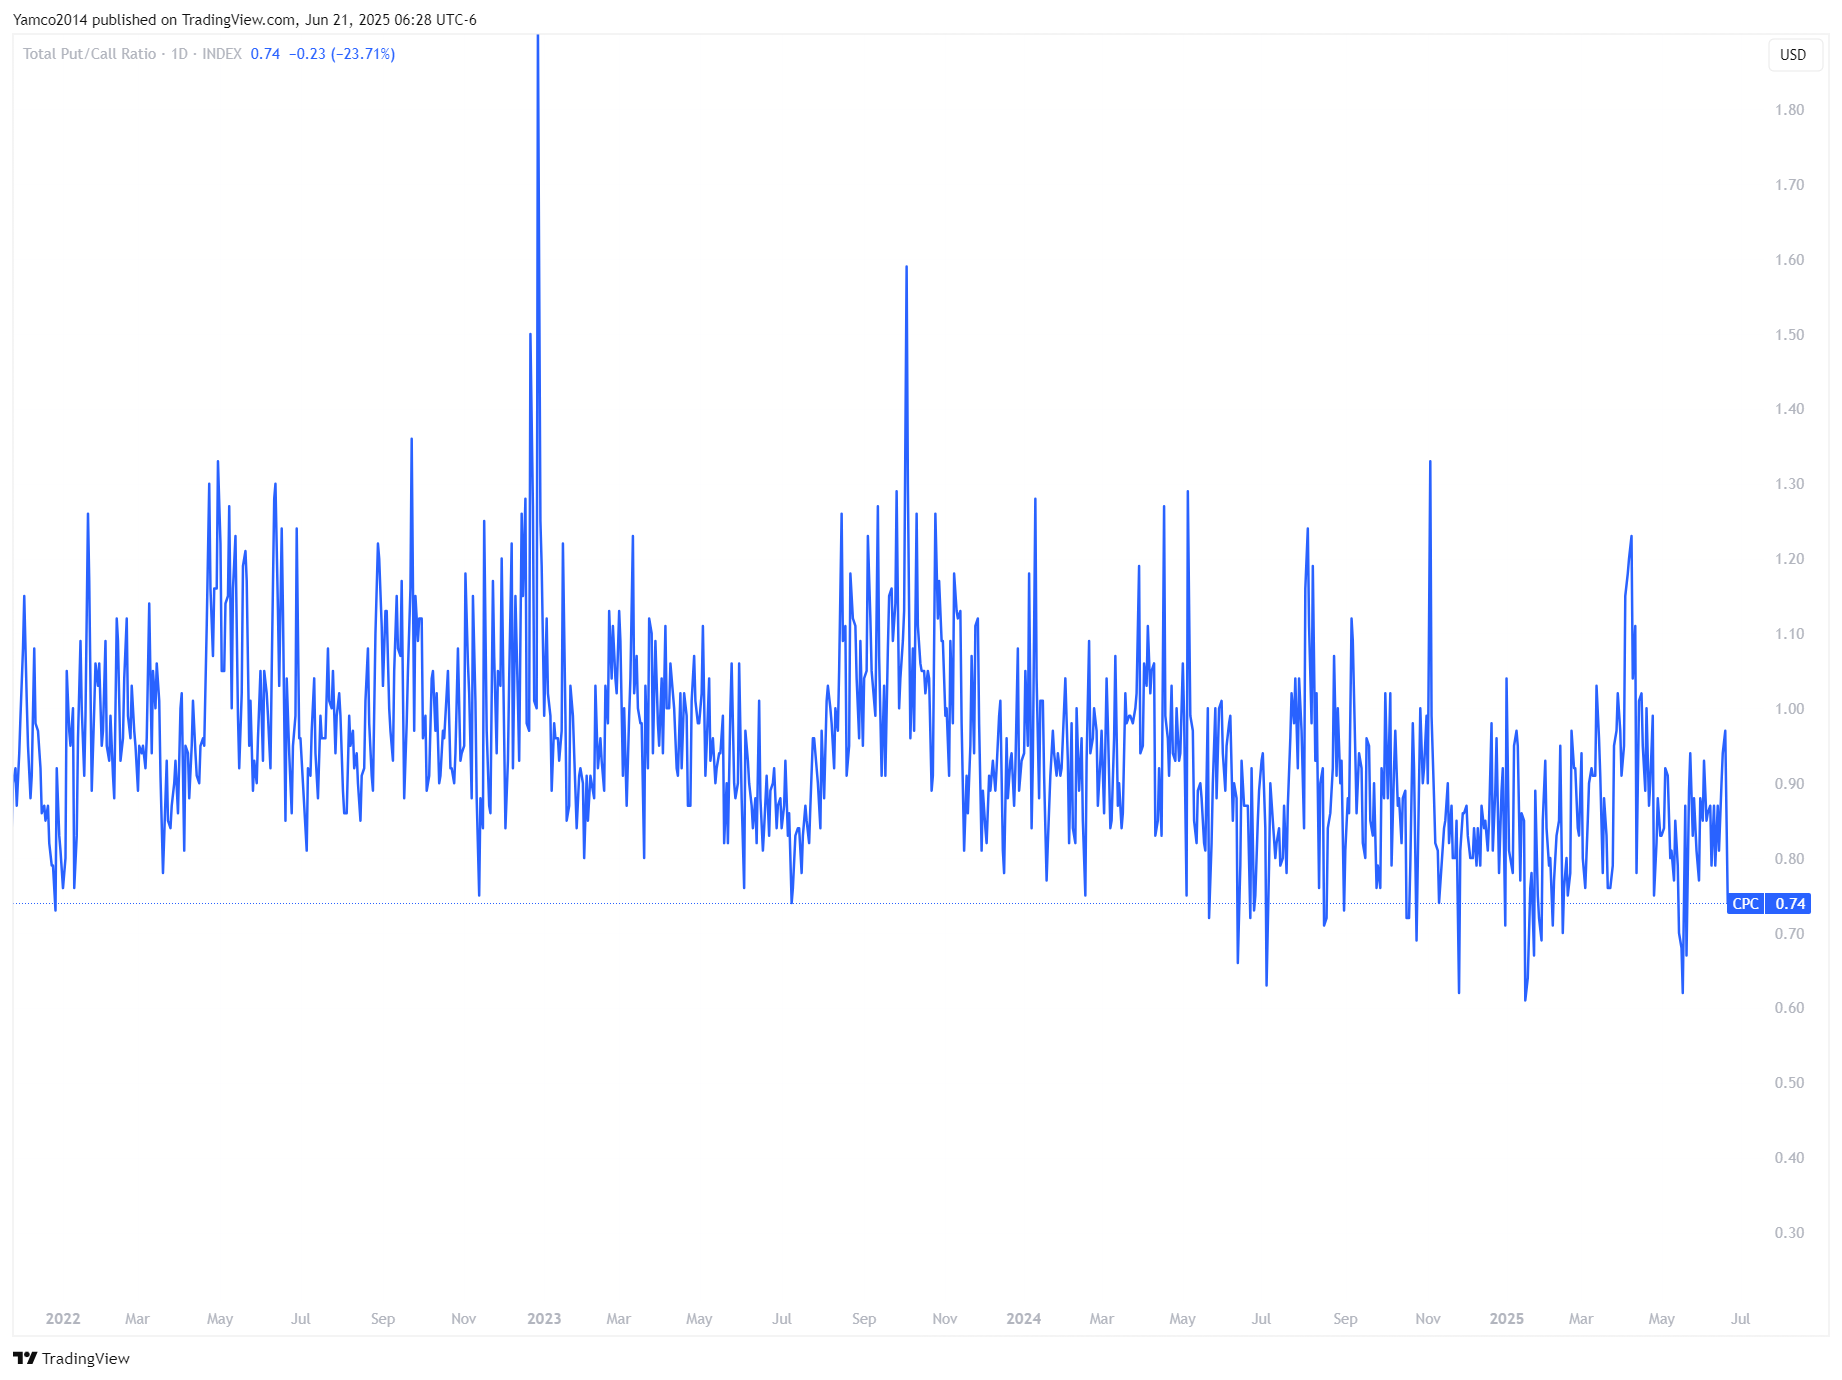
This metric has pulled back from .81 and is currently at .74. Afterall, we just saw OPEX and VIXEX roll off so seeing a move down in the metric makes sense. We’re currently at the relative low for the past 2-3 years. I believe this shows the market is pretty well balanced with a bias to upside in terms of options positioning.
Entropy
This is a model built by Machina Quanta ( https://substack.com/@machinaquanta?utm_campaign=profile&utm_medium=profile-page) that captures the disposition of market pricing across time.

Quick reminder on what entropy represents
When most people here entropy, they think of disorder/chaos - that's the literal
lack of order or predictability; gradual decline into disorder.
Entropy was actually used for finding anomalies in EEG readings for cardiac patients. It could detect anomalies (because EEG charts are cyclical) where patients were about to have an imminent heart attack with good accuracy. It comes from the field of signal processing and information theory. It looks for changes in patterns and where a pattern diverges (it doesn't need to be cyclical pattern though...it could be non-cyclical, like an interest rate keeps rising until it blows up the country like Turkish Lira 20 yrs ago). Since, you're a math guy: the math equation is (we use a different variant) -sum[ p(x) log(x)]. <- this is basically, sum up a distribution of finite buckets.
where,
x = the state
p(x) = what proportion of participants are in this state
So, we have a bunch of states - in our case slices of market participants. Some market participants are short a lot, some are long a lot, some are neutral, some are a little short, some are a little long...imagine a spectrum of 10 investors views.
Normal market (each 'state' has a normal or maybe uniform distribution of views) - high entropy, there's no signal as things are going smoothly (i.e., the EEG looks normal, the person is healthy, their heart chart pattern is behaving exactly as it should - no heart attack)
**Distribution of market participant views below**
Normal market
[0.1] [0.1] [0.1] [0.1] [0.1] [0.1] [0.1] [0.1] [0.1]
Abnormal market
[0.7] [0.25] [0.05] [0.0] [0.0] [0.0] [0.0] [0.0] [0.0]
Abnormal market: distribution of states have almost all shifted to one side. In what market scenario does correlation of assets and market views go to 1? The EEG analogy - wow there's a burst in the cardiac chart or wow the amplitude of their readings is much lower than it should be...something is off with their heart. What happens after this is heart attack generally or some physical ailment.
Let’s break the entropy indicator down into what it’s showing. Market had highly diversified views which shows stability in the market. We’re seeing a small down tick in the entropy which might signal some upcoming weakness but nothing particularly of note.
Take a look at this zoomed in picture around MAY Opex

Entropy moved up into OPEX and showed a bit of staggered weakness before the market pulled back.
CBOE VIX Volatility Index (1 month forward volatility of VIX)

The 30 day forward volatility of VIX is back to elevated levels from the relative lows we saw two weeks ago. The market is showing a bit of concern given the elevation of VVIX but consider what ends up happening when volatility settles down.
Cross Asset Observations
BTCUSD

BTC broke down from this consolidation range/flag and is below the 8/21 EMA. I like to monitor BTCUSD as a general risk barometer. It’s now under the 50D with quite the confluence of supportive areas underneath
200D at 95k
big S/R zone from 98-100k
Rising Support Channel + Major S/R zone from 92-95k.
I’ve been calling out IBIT 0.00%↑ flows for the better part of the spring (April to June). I’m eyeing a look below and reclaim of 98k to express a long and would really prefer the 92-95k range. The most likely scenario is an ON flush and recovery (as it always is)….
USD [Using UUP 0.00%↑ as a proxy to DXY]

This zone goes back to 2019 and has been a great S/R for Dollar strength. Since pre-inauguration , the Dollar Index ($DXY) fell 11% and is now bouncing in this S/R zone and has broken out of this downtrend from the pre-inauguration highs.
The past week and chance, I’ve logged some significant options activity on UUP 0.00%↑ (for the ETF), but it’s a ~ 200M AUM ETF so keep that in mind… the FX market is massive multiples larger.
Uranium - $U.UN

I mentioned this months ago and it’s flushed the 200WMA and this multi-year trend line in April. It went on to flag under the 50W MA before popping over this week.
We have some exposure to DNN 0.00%↑ and URNM 0.00%↑ but I’d like to see some consolidation in the Junior miners URNJ 0.00%↑ to get a bit more long in the Uranium sector for higher beta assets.
Just want to note an observation on QQQ 0.00%↑ since May OPEX - The distribution of volume candles shows some selling distribution as red days were generally higher volume than green days. While QQQ 0.00%↑ is above the 21D, volume patterns are something to watch - NQ has had a few near taps with the 21D EMA (the past week or so, we’ve seen many ON moves down that were rapidly bought back up.

I generally feel tech will be hit the hardest if we get any downside movement in the coming week(s).
Key zones to watch
In no particular order, we have a few big zones on the chart to watch.
First…. We’re in an environment of high volatility driven by headlines so these levels are going to be wide
From low to high:
5560: April 1 Lows
5570: Weekly Straddle Low
5575: Mar 2025 & Tariff Day Swing low
5610-5615: FOMC supportive downtrend.
5635-5645: AUG/SEP 2024 Highs
5660-5680: Tariff Breakdown Level
5710: Pre-election Lows & MAR 2025 Swing high (several times)
5750: Early March Lows & 50DMA (5736)
5775: Mid-January 2025 Low, Late Mar 2025 High, Election Gap Bottom; Weekly 50EMA (5766)
5790 - Weekly 21EMA
5810 - 200D MA
5850: MAR 2025 Breakdown
5900-5905: Upper range of post election pull backs; EOQ Collar
5940-5950: Late February Breakdown & 21D EMA
6000: Post Election NOV highs, Swing High Early Jan
6050: Post FOMC early Jan Swing High, FOMC Breakdown
6100: Lower level of ATHs
6150: ATHs
Let’s Put these on the char

Each of these identified levels is a guide to price action to watch into the next week.
They might each cause an extreme response as a squeeze might accelerate or a new sell off might begin.
Tie it all together
Straddles and 15/25 delta pricing remain elevated this week while OTM skew is growing into Friday showing continued concerns for downside range expansion.
Term Structure shows rising expectations for volatility moving forward into the July Tariff Pause but is generally in the middle of the past two weeks for forward volatility expectations
Net Options positioning expresses a corrective tilt for the next week after Quarterly Opex and into PCE/Friday before Month/quarter end.
Entropy is showing a slight pullback similar in structure to the May OPEX pullback. A few days after Entropy fell, we saw the market undergo a minor correction that got bought back.
Technical environment shows that near term, the market is correcting under the hood with the percentage of stocks below the 20D under the average while longer dated technical indicators (% of stocks over 200D and 50D) are higher due to the dates these indicators are covering.
BTCUSD is showing a bit of weakness and is generally a leading indicator to the market. See April’s PA during the Tariff scare.
Summarizing the above, the market looks setup for a bit of a consolidation/slight correction phase but remains setup for a larger move into July OPEX and August. I believe any near term weakness remains an opportunity to buy.
On to the position updates, and trades I’m watching.
Keep reading with a 7-day free trial
Subscribe to Yamco to keep reading this post and get 7 days of free access to the full post archives.