
Positioning and Week Ahead [08/03]

If you ever wondered what Dispersion meant, here it is in a nutshell… Mega winners, mega losers
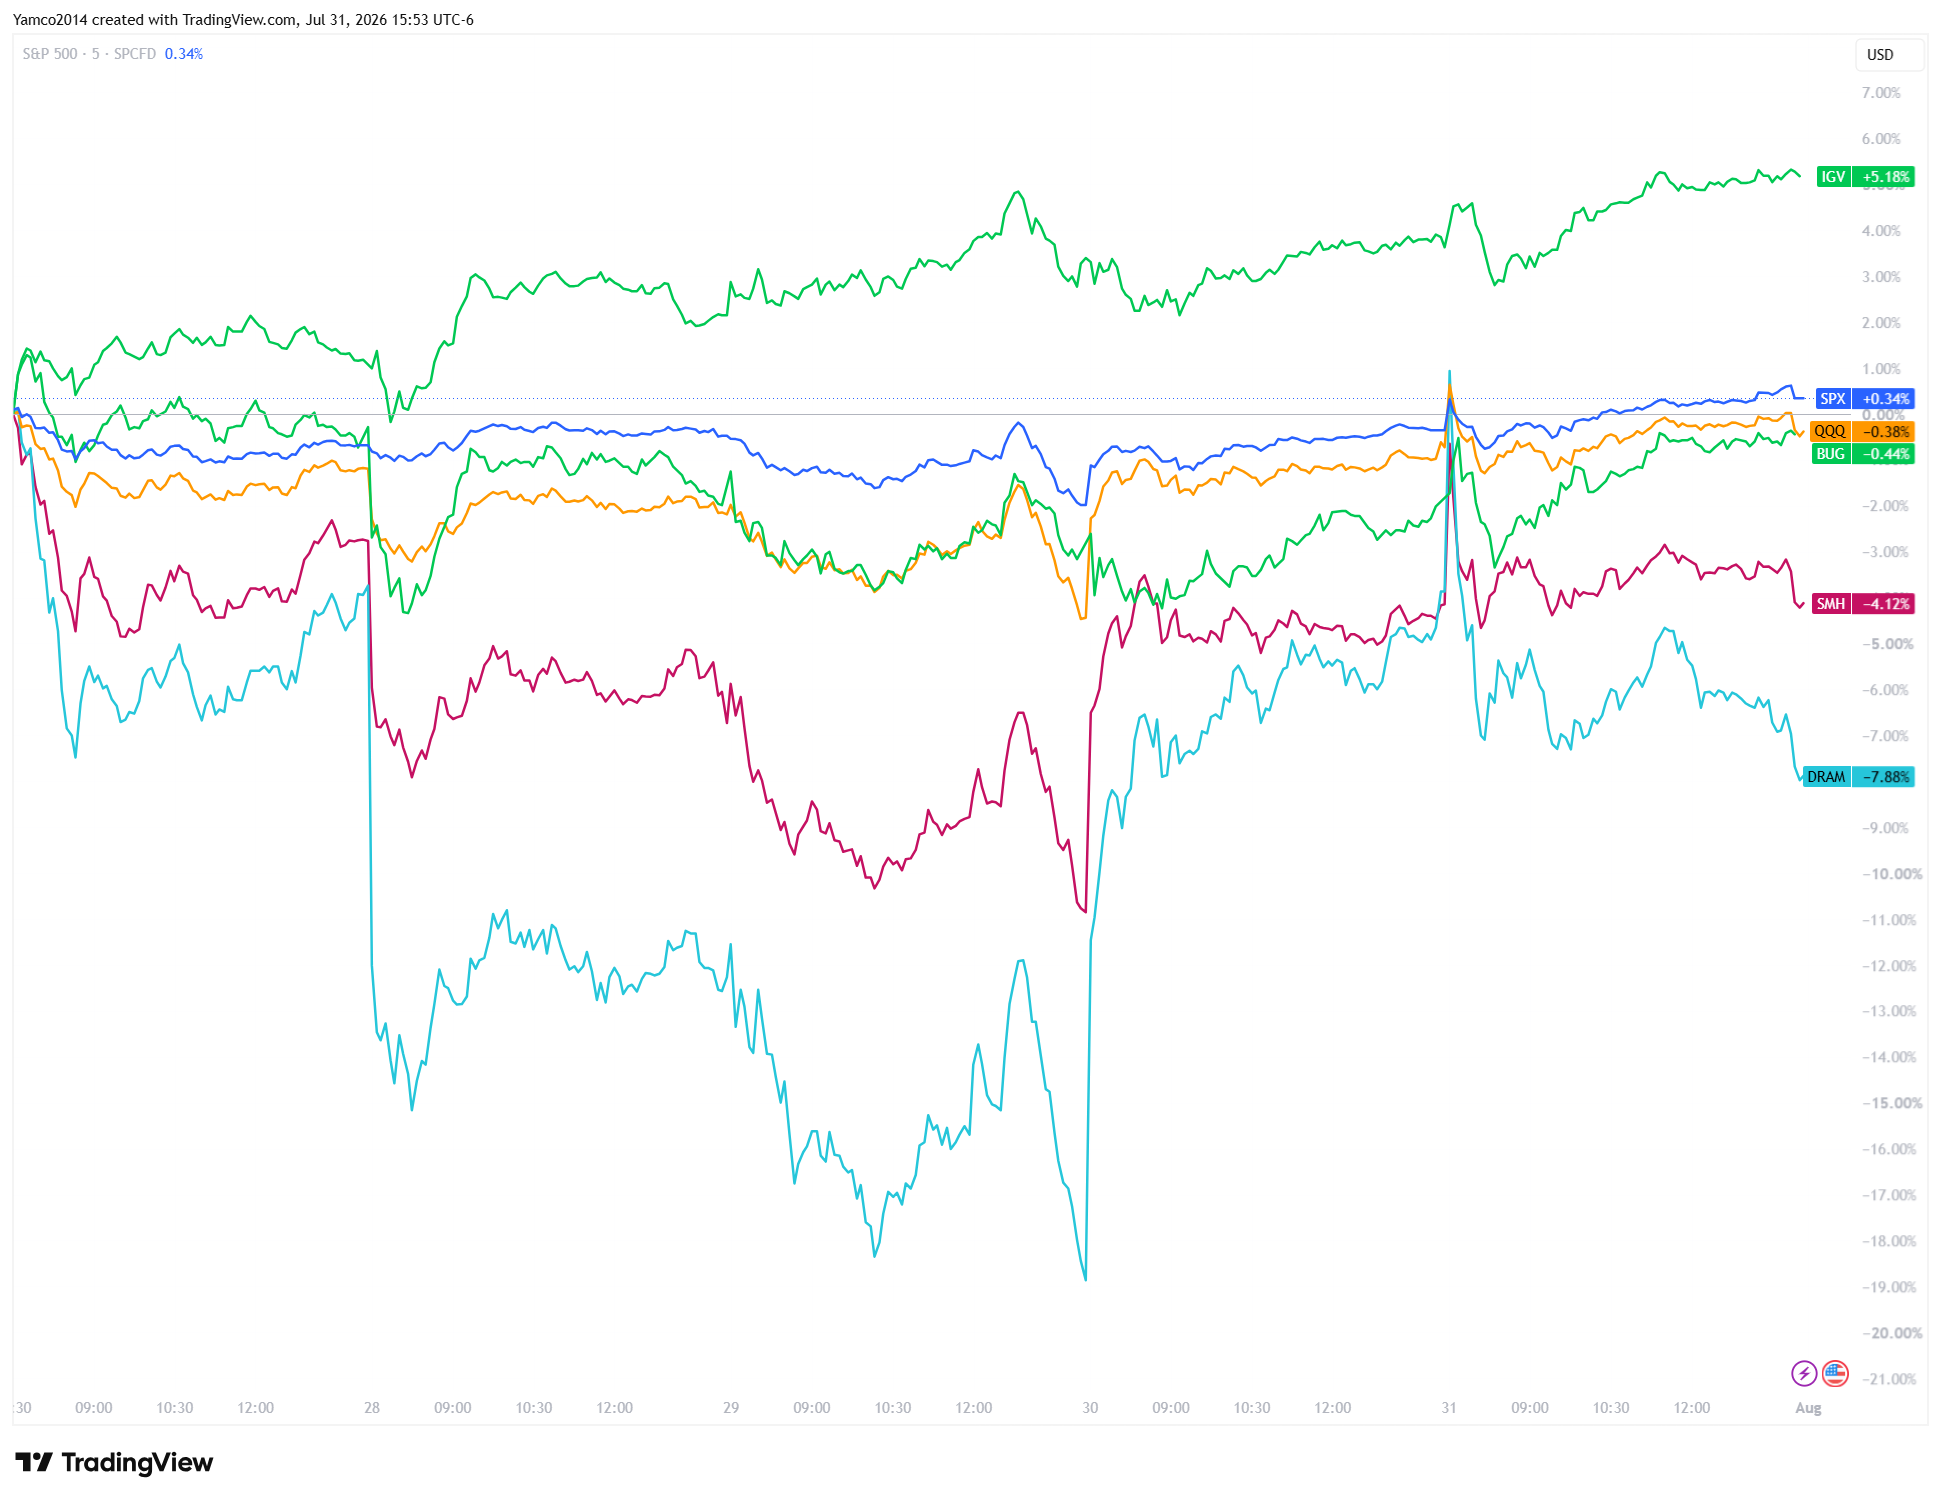
I’ve been touching on Dispersion, and momentum volatility but this chart is truly just something else…
Week Ahead Summary
The weekly straddle is 100. We continue having great intraday volatility and appear on the surface to be recovering out of the latest correction to 7300s. As I said this past week, the markets were approaching a reversion bounce - let’s see if this is another short opportunity or if the market has a risk appetite to continue with these stocks. FOMC - nothing burger, CAPEX - no slow down, earnings - great… fundamentally, the fears should have subsided.
Realized Volatility is on the rise - just as Tony and I said on the 07/23 spaces and have been saying for the past two weeks. This matters because VCFs are reducing exposure - it’s a piece of the puzzle so any future drops will hit a little harder. On the flip side, as RV starts to compress in a month, there’s predictable liquidity.
Net positioning is generally negative gamma at spot with positive gamma at the wings, Market lets set to defend any dips and absorb momentum to the upside.
ADV line is making new highs as price is finally making a push higher.
While the push higher is extreme constructive, there’s going to continue being bumps as we have yet to even test the 7605 level where the June sell kicked off from. It’s unlikely the market just goes through painlessly and likely, upon testing, throws up a bit.
Summarizing the above and looking forward, the environment as dictated by VIX term structure has remained bullish with some violent moves in single names. The market is generally rotating beneath the surface, “internals” look strong, and the fundamentals required to drive the market higher are present. It’s time to watch and see if the MACRO matters at all to the market or if we received the All-Clear after Situational Awareness blew up, FOMC was nothing, and earnings came in spectacular. My general view is the market remains bumpy as overhead supply is worked through.
Topics covered
State of the Market
Next week
Straddles with 50/70 percent ranges
Term Structure
Total Market Structure
Net positioning (Aggregate and by day)
Technical Structure of the Market
Sentiment
Key zones to watch
Charts of Interest
State of the Market
ES VWAPs
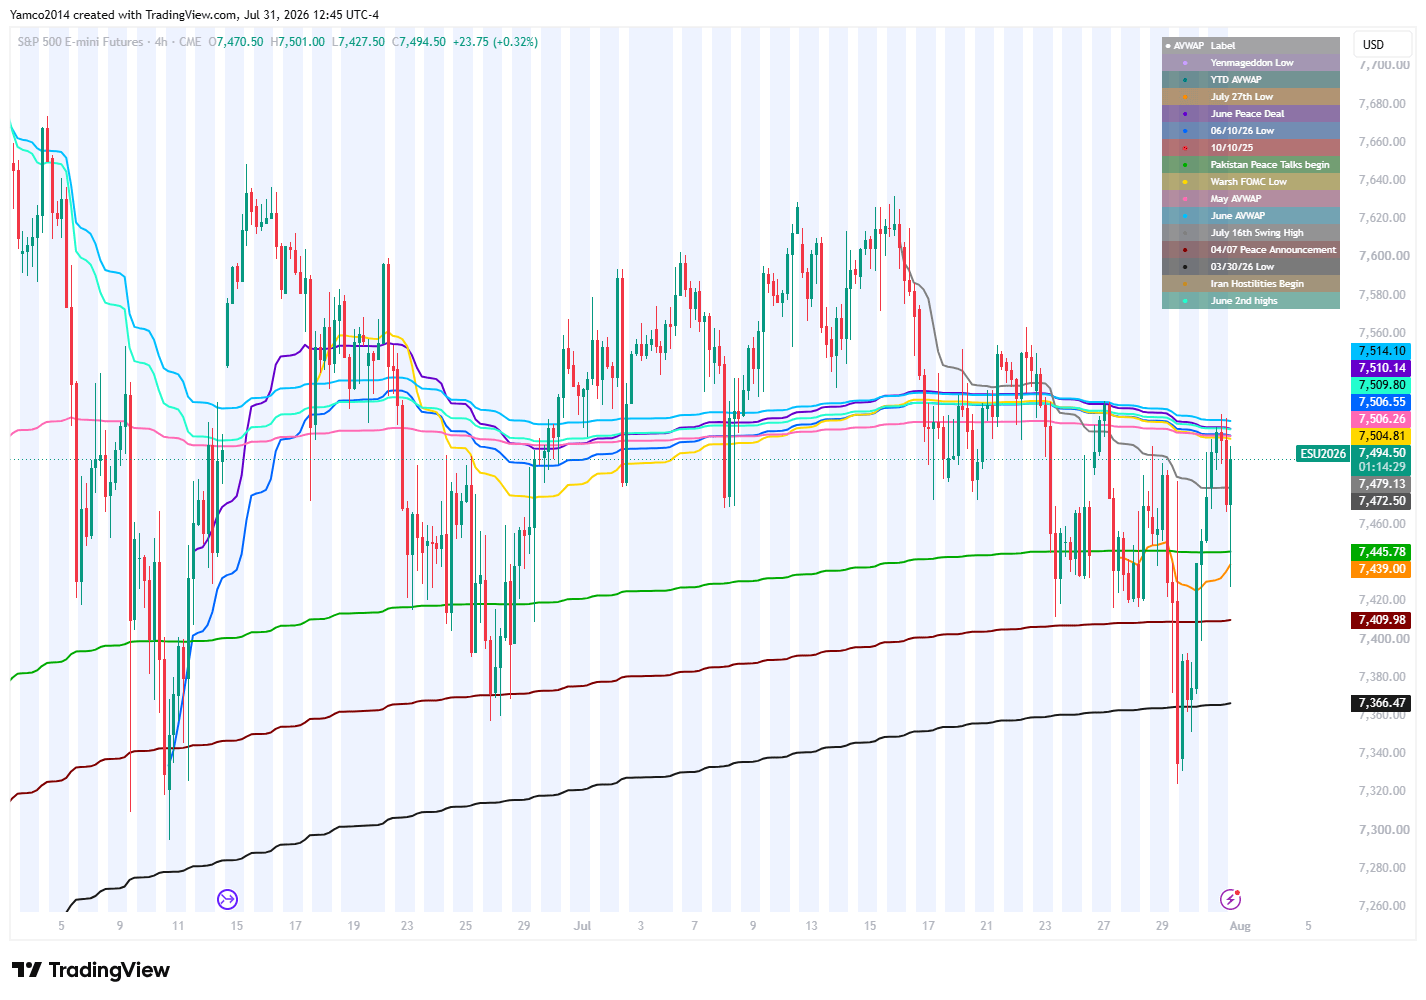
Consolidating just under this cluster of VWAPs after flushing the March 30th low AVWAP. The most notable VWAP up here is the 6/10 Low + Warsh FOMC VWAP.
NQ VWAPs
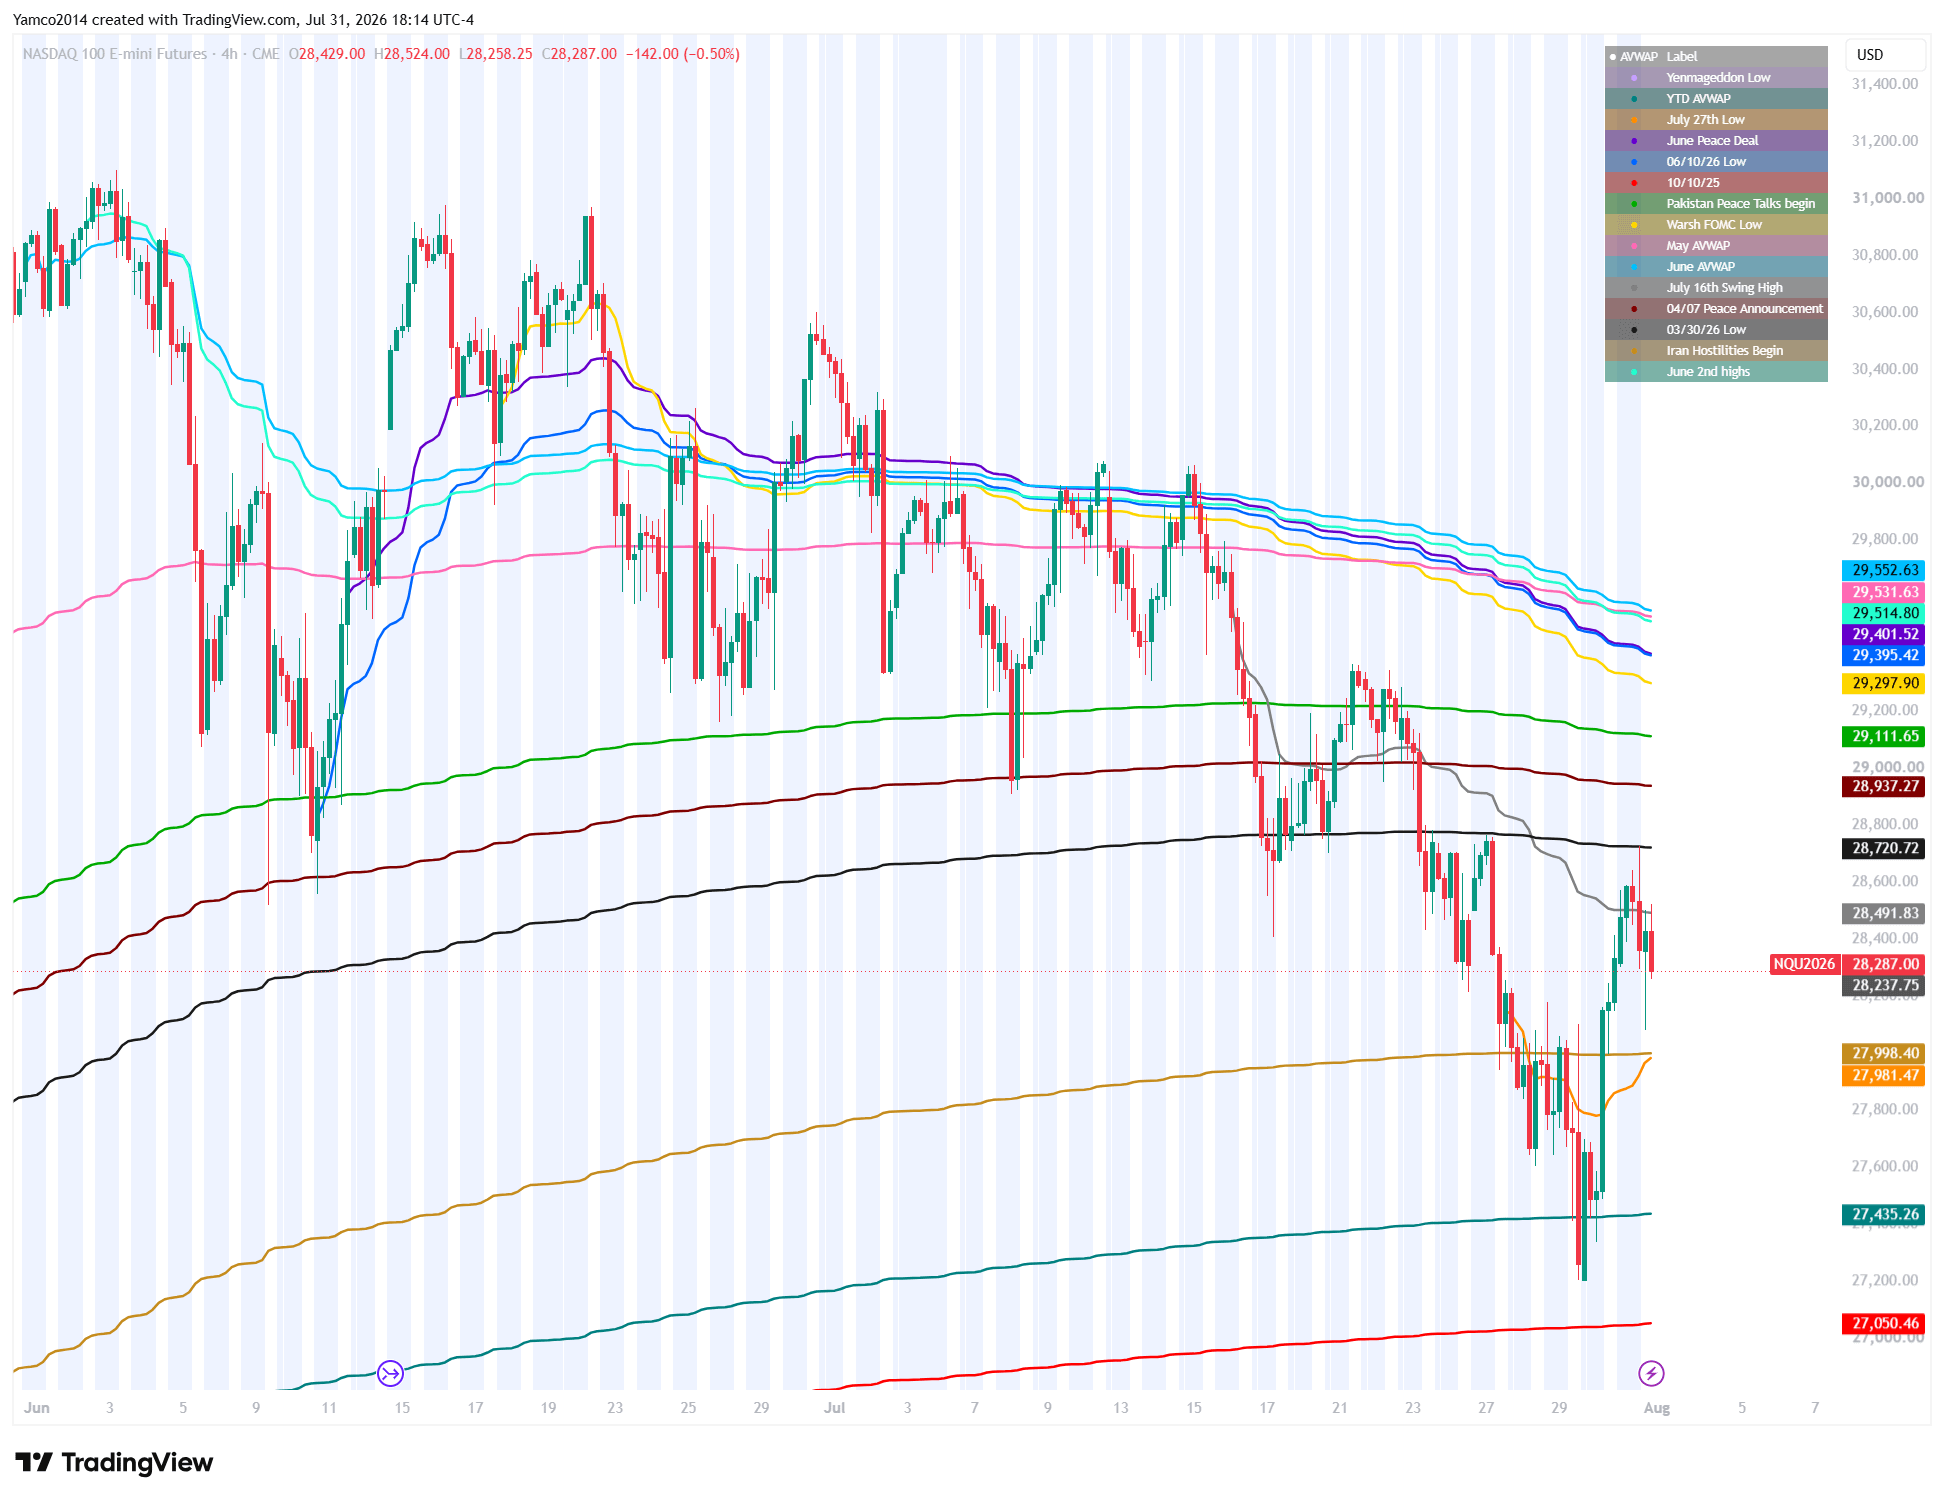
Flushed/recovered the YTD AVWAP, and rejecting the 03/30 AVWAP from underneath. Initially coming out of a deep over sell on the back of FOMC and the situational awareness fund blow up.
RTY AVWAPs
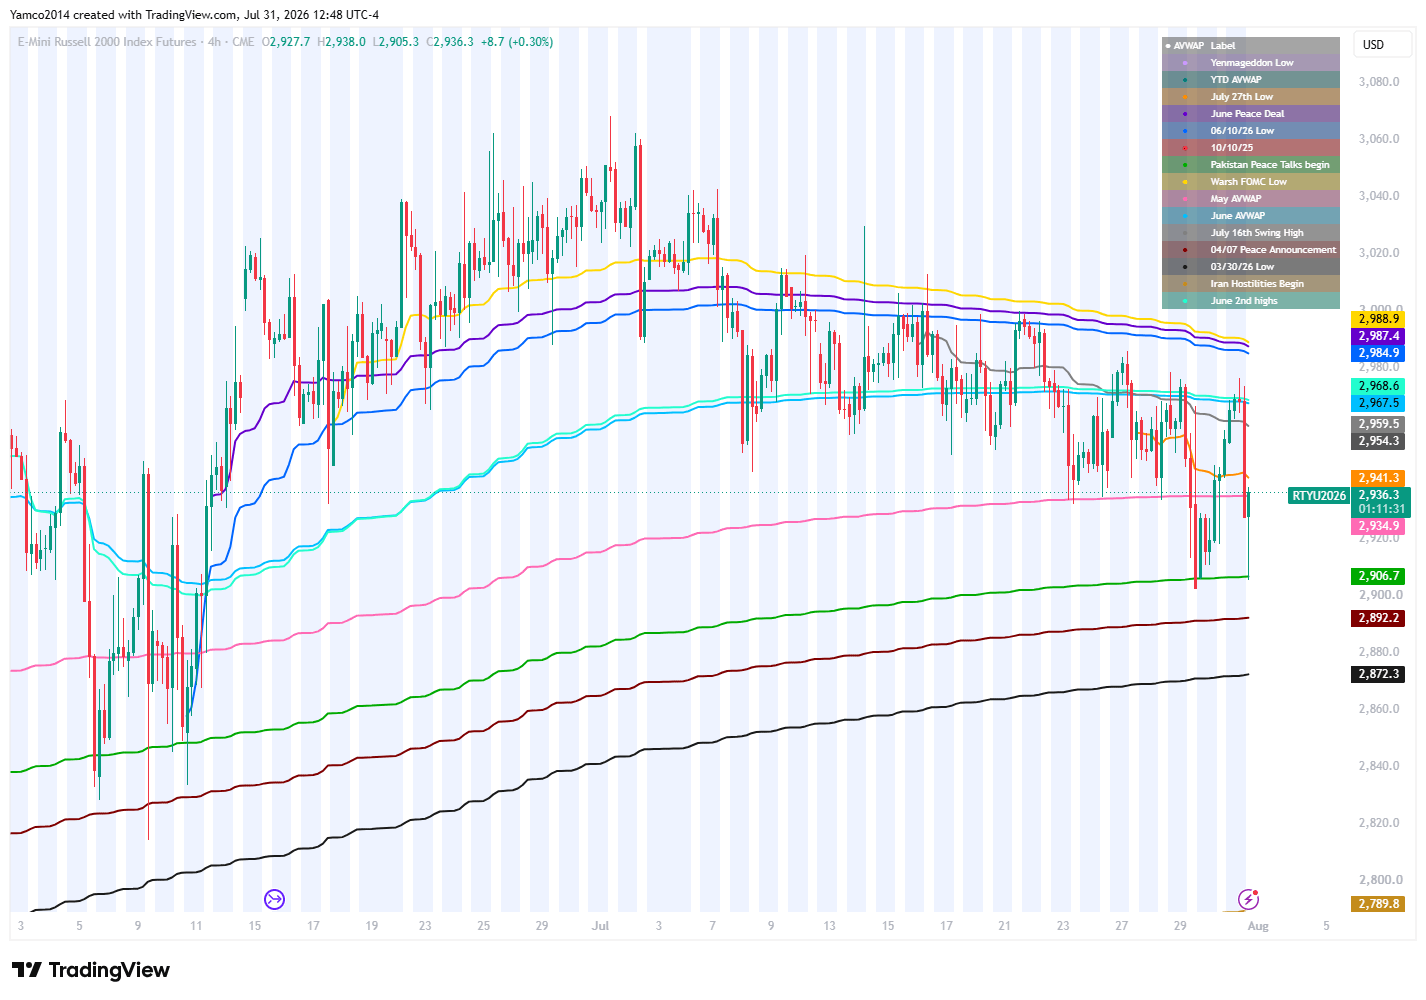
Still has yet to test YTD AVWAP and showing quite the strength, althought it looks tired and is slowly moving down.
Why is this important?
Well….I see AVWAPs as a moving volume profile vs static one and think they’re very useful in looking at price movements.
Indicator Used
I published it on trading view AVWAPs, MAs in one
It takes a bit of setting up but you can do it!
Where are we
The good - Structurally, the market is repairing some major damage and the market at large is attempting to reclaim the major moving averages - finally got over the 21D after 3 rejections and 6 days underneath. Two consecutive higher lows and a close over 50D.
ADV line slightly off the highs while market is undergoing repair after concerns of CAPEX, aliens, and a few other common talking points were proven wrong.
VOL crush is in full effect
Hyperscalers are at an inflection point in profits and are confirming CAPEX isn’t slowing down.
The bad - rates at the highs, Hormuz something or other, breadth or something… long list of stuff on fintwit - I poke in jest at these topics because they often don’t matter and are fuel to go higher as people buy puts.
QQQ is rejecting the 21D EMA from underneath still and finally closed over the 10SMA for the first time in nearly 2 weeks.
Small caps are losing the 50D and slowly chopping down
Dispersion and you!
Simple chart showing dispersion (green) and forward 1M correlations (Orange) - basically the market looks fine at the index level but individual stocks are having massive underlying moves. We’ve come out of a period (briefly) with 99th percentile dispersion, correlation combinations for a few days before entering back into the environment.
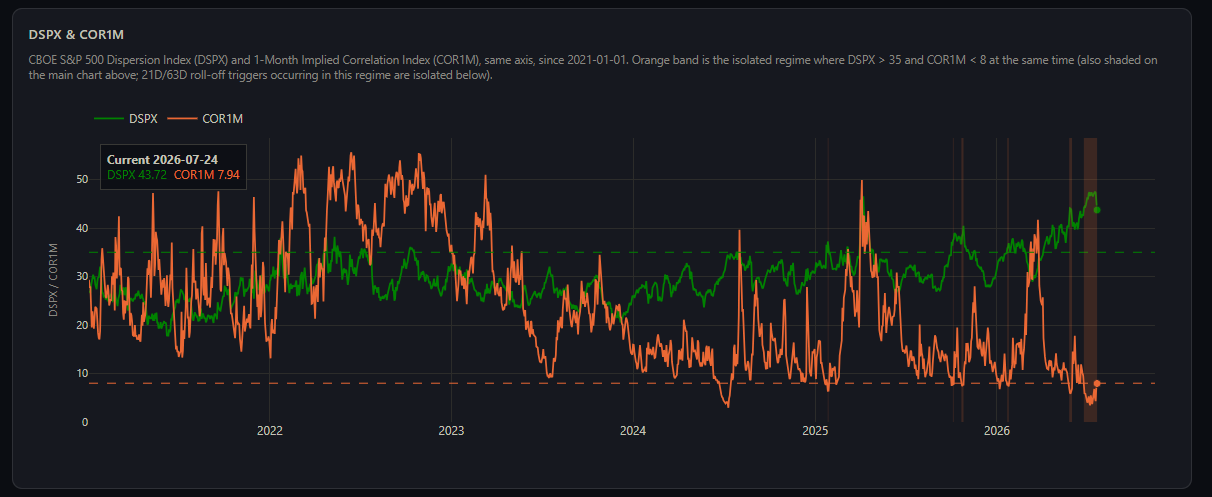
The market can stay in this regime due the gross leverage being so high while net leverage is neutral
VIXEQ (Single name stocks) / VIX (Index)
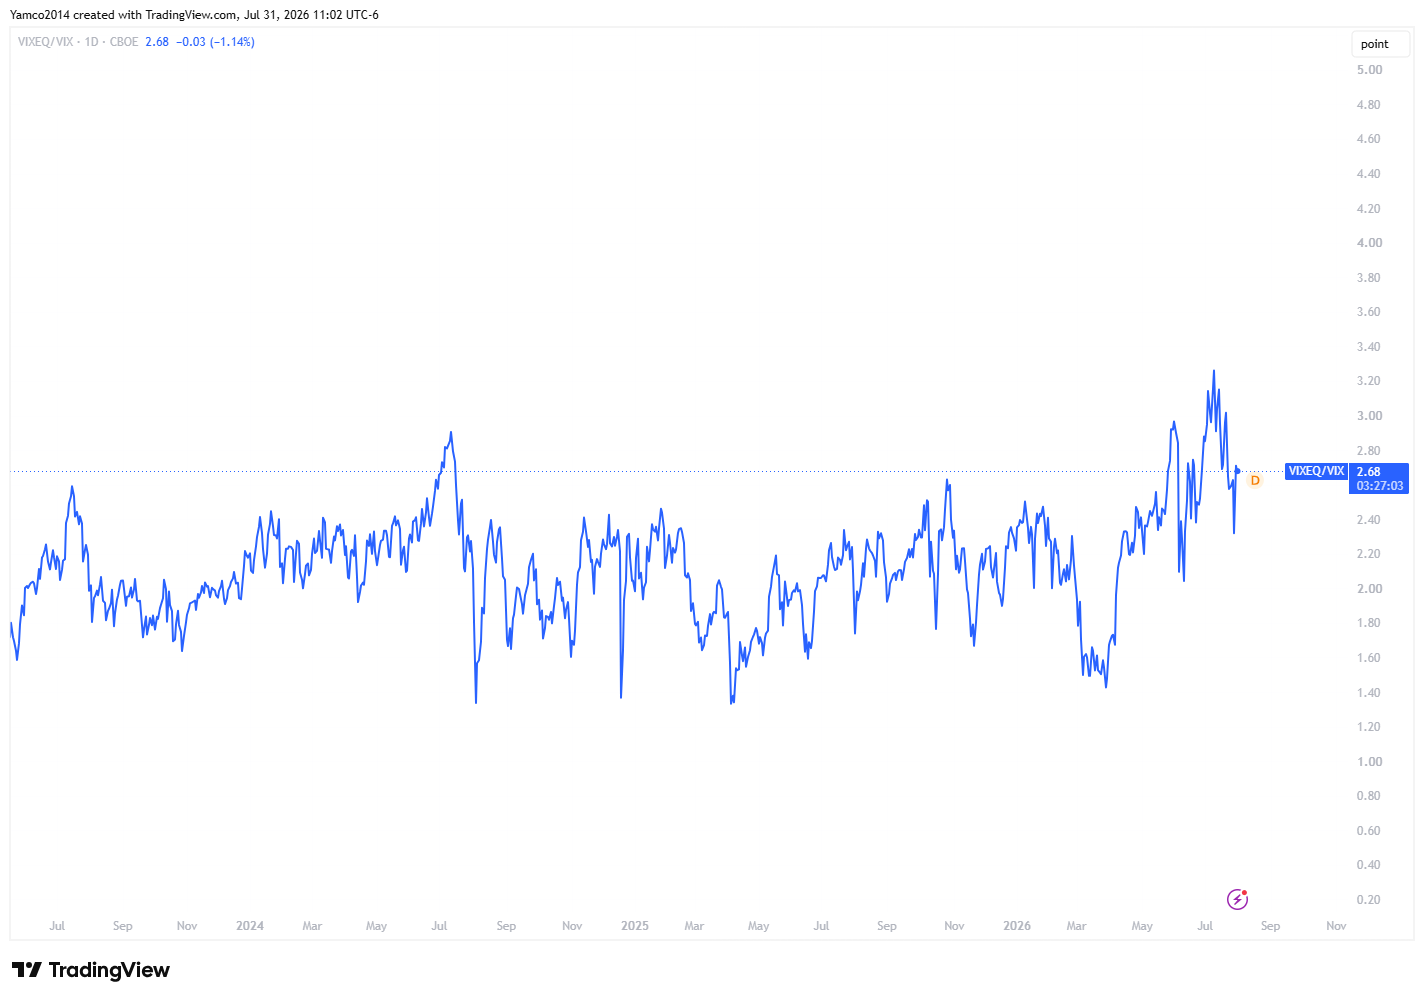
While we’re at it - let’s take a look at VIXEQ/VIX - the ratio of single name 30D volatility v index volatility. It hit an all time high and is now normalizing after earnings season.
SDEX- Cost of crash insurance
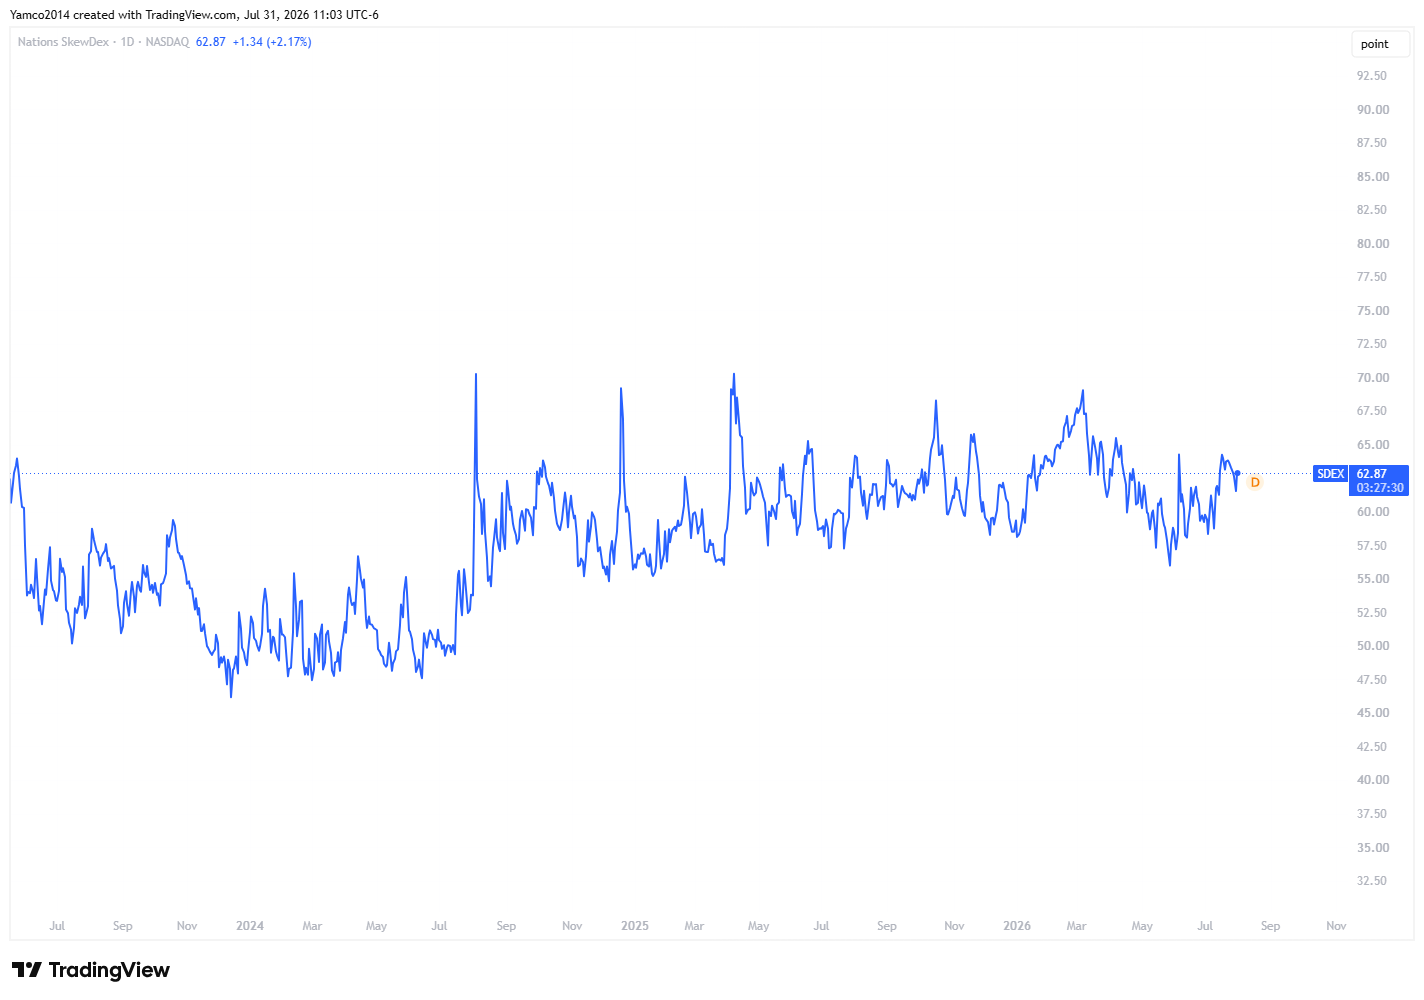
As a former actuary, I really like covering this metric
SDEX is “How much does it cost for crash insurance compared to an ATM put.
Back in the historic range (at the highs)
Note: When the VIX is high, the 1-standard-deviation strike is further out-of-the-money.
Trend Change
Found this here: Trend Change
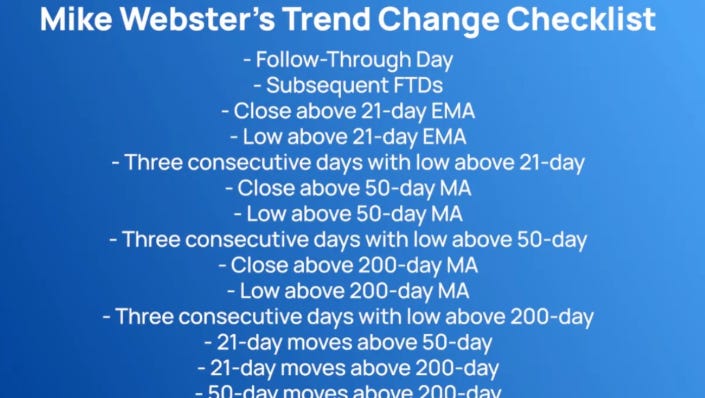
Market is doing some of the above but generally still needs to prove itself to show trend is establishing.
Week ahead
Next week
Straddles with 50/70 percent ranges
Term Structure
VIX Futures
Gamma Surface Model
Realized Volatility
Net positioning (Aggregate and by day)
SPX
VIX
Technical Structure of the Market
Sentiment
Key zones to watch
Economic Calendar
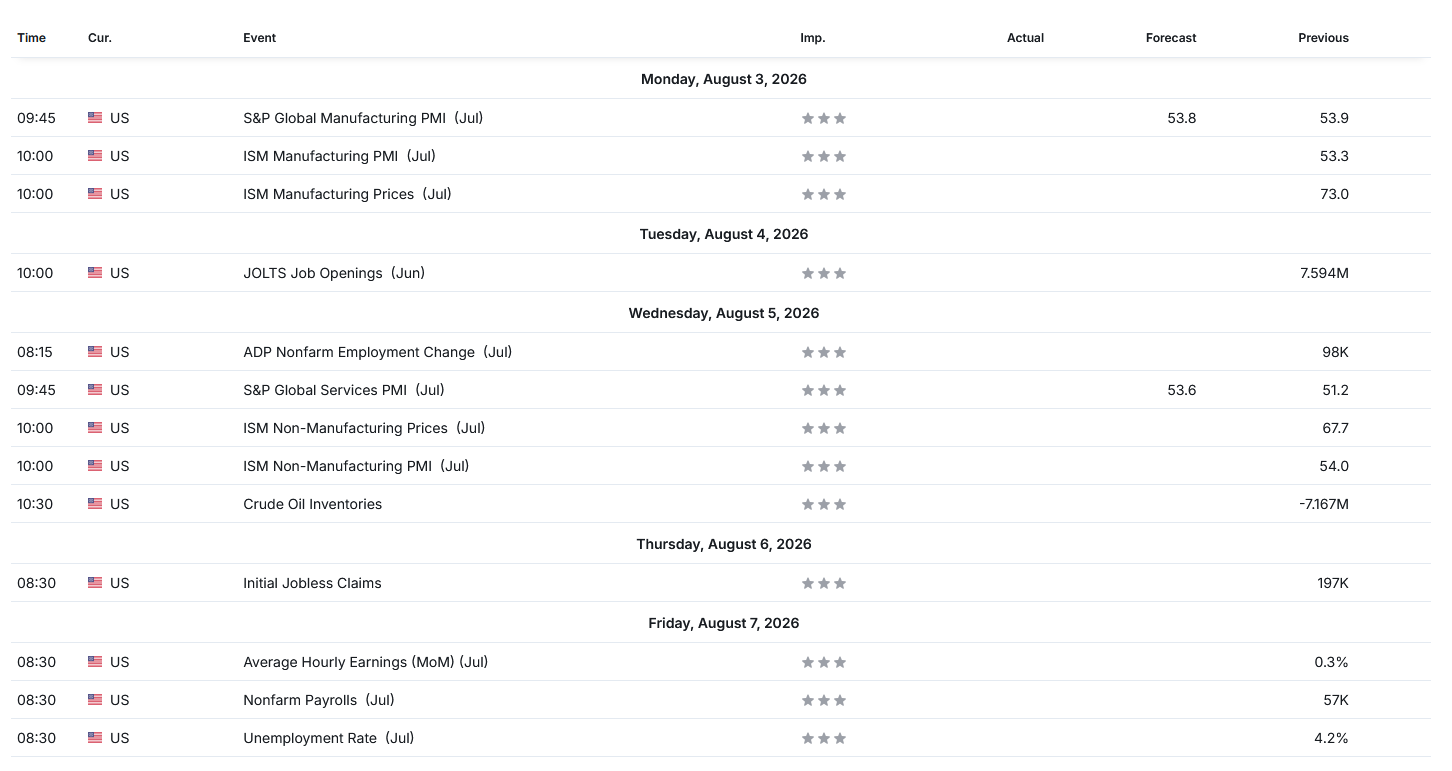
Let’s look at next week’s events: Jobs - Generally expect none of it to be of significance.

I added some general explanations of my scanner to the Review of Positioning Metrics (Keeping everything in one place)
Straddles with 50/70 percent ranges
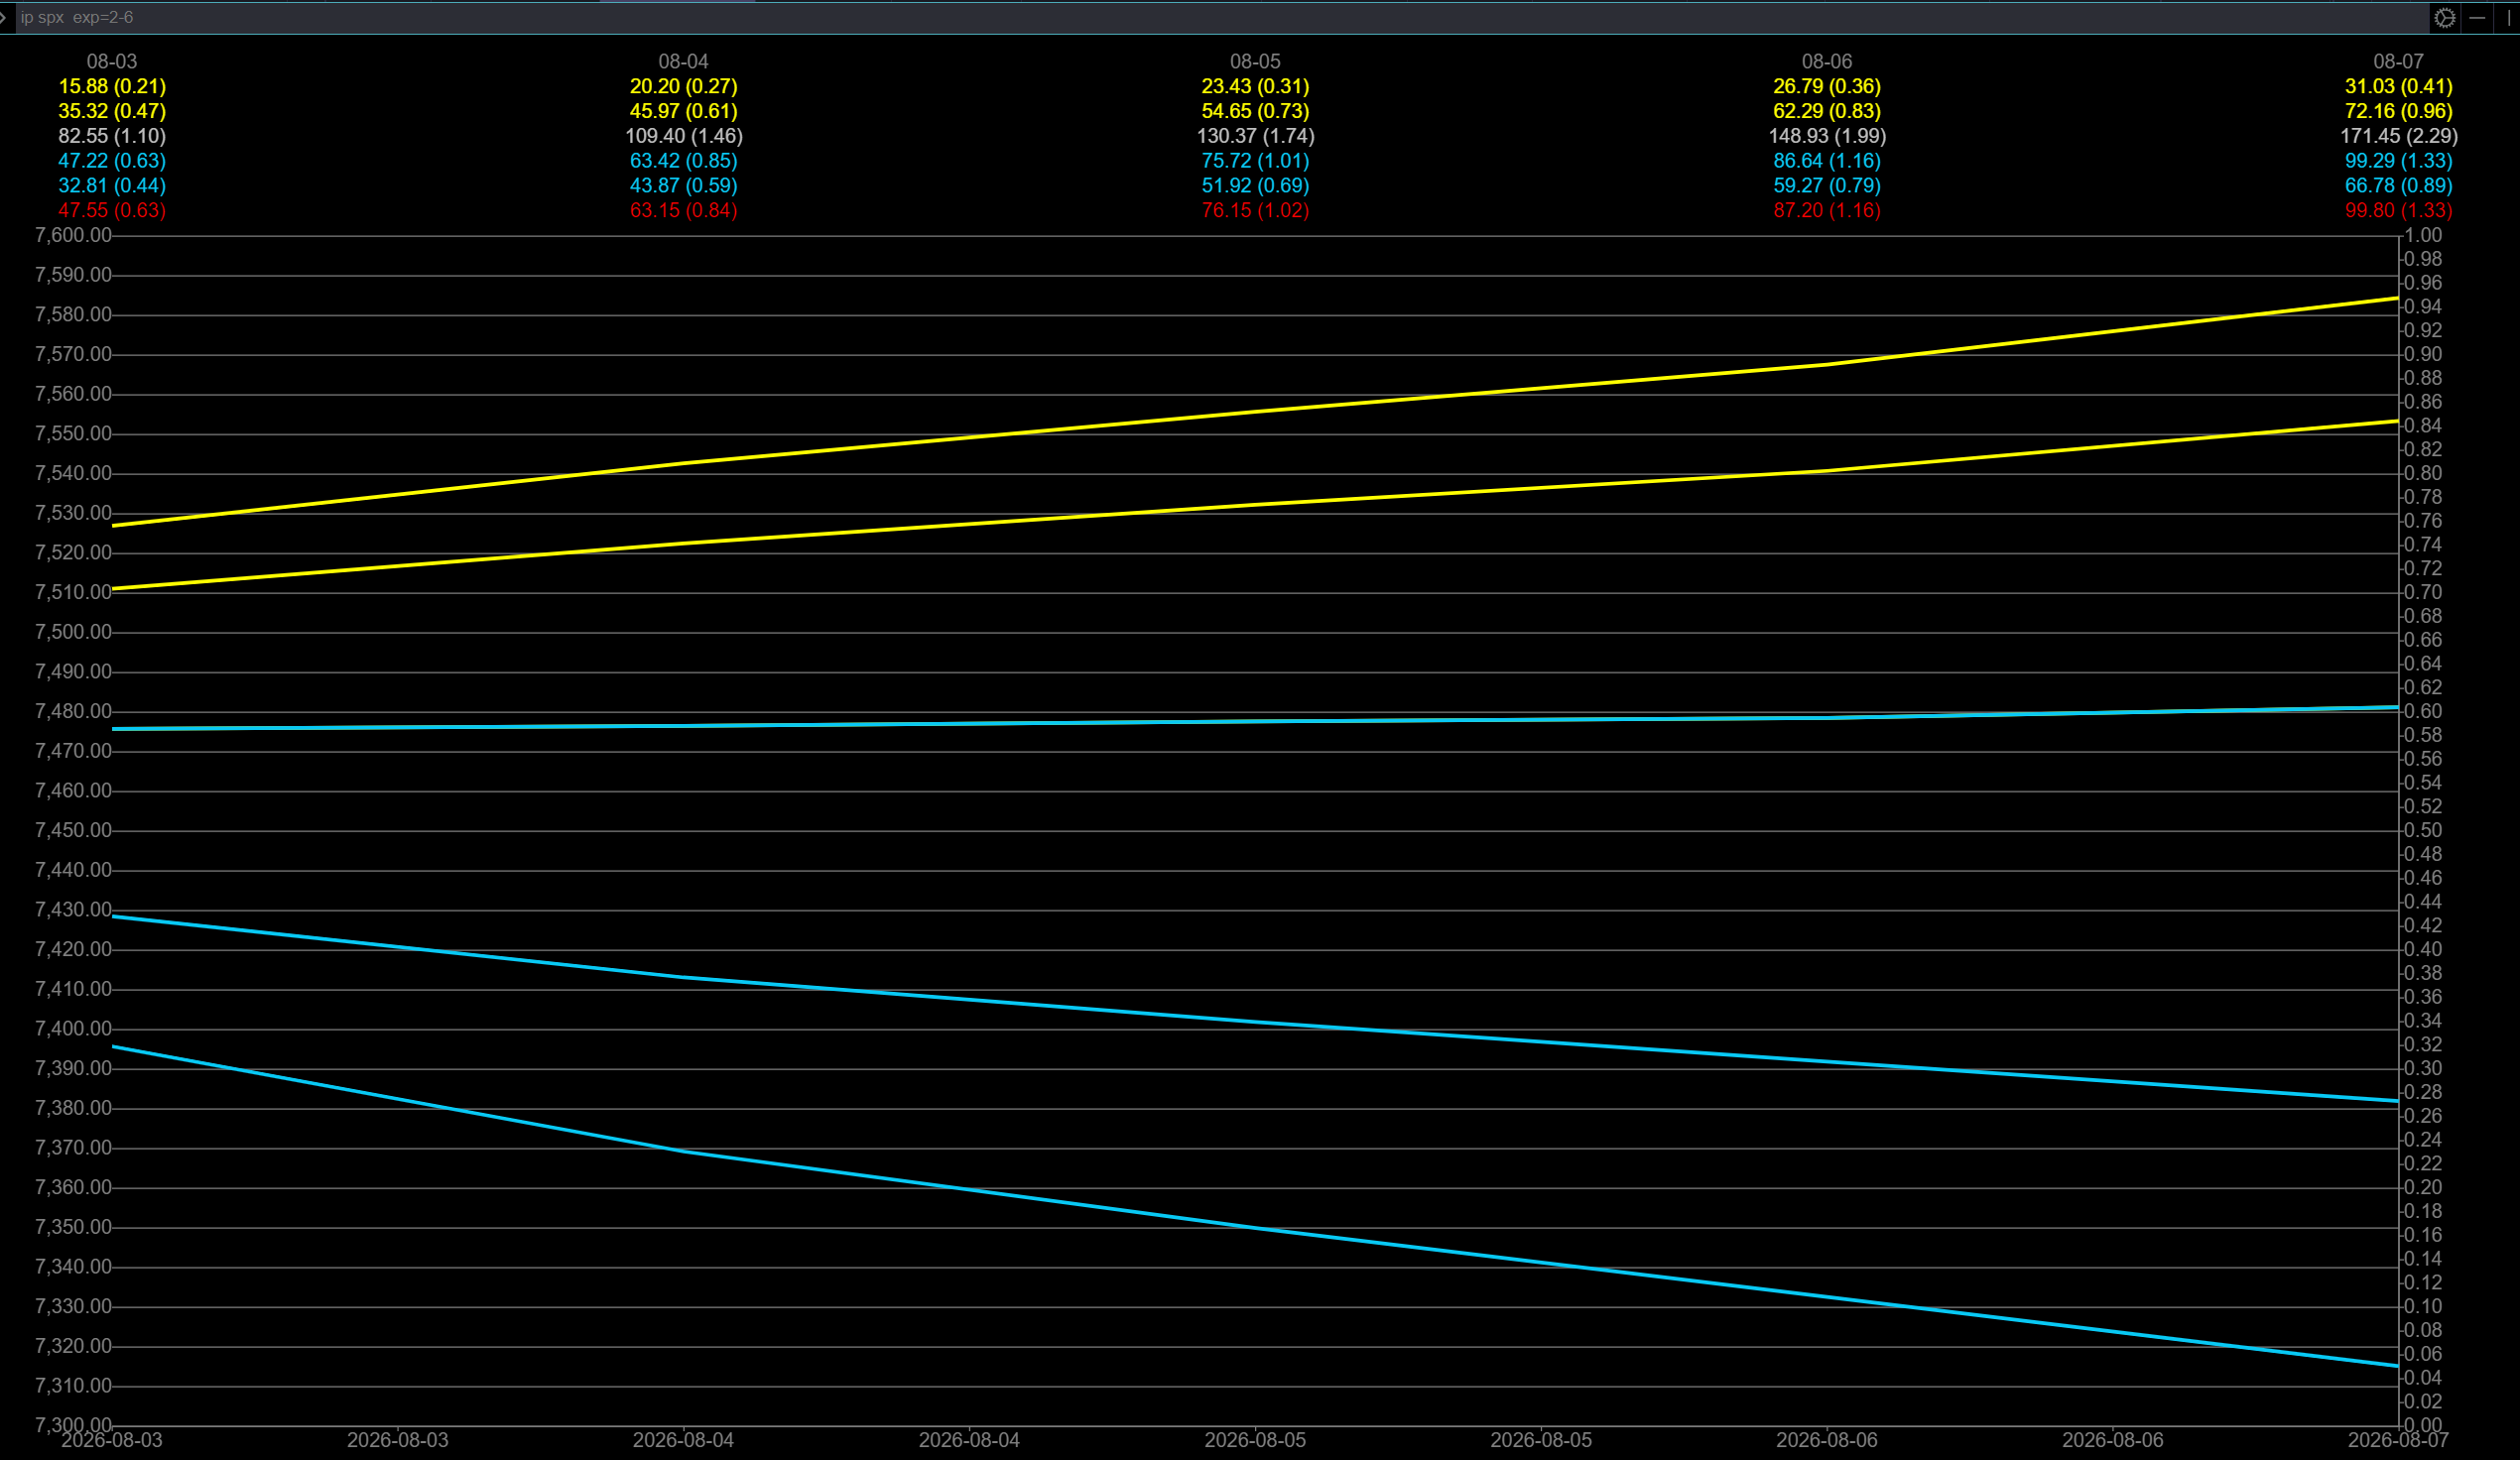
Various Time Frame Straddles
Weekly Straddle Range: 100pt straddle implies a weekly range of [7389,7589]
August MOPEX Straddle: 273 pt range implies a OPEX to OPEX range of [7174, 7730]
September QOPEX Straddle is 459 pt giving us a range of [7041, 7960]
This is from June OPEX
DEC2025 OPEX to DEC2026 OPEX is 945 points giving us a range of [5889,7779]
Term Structure
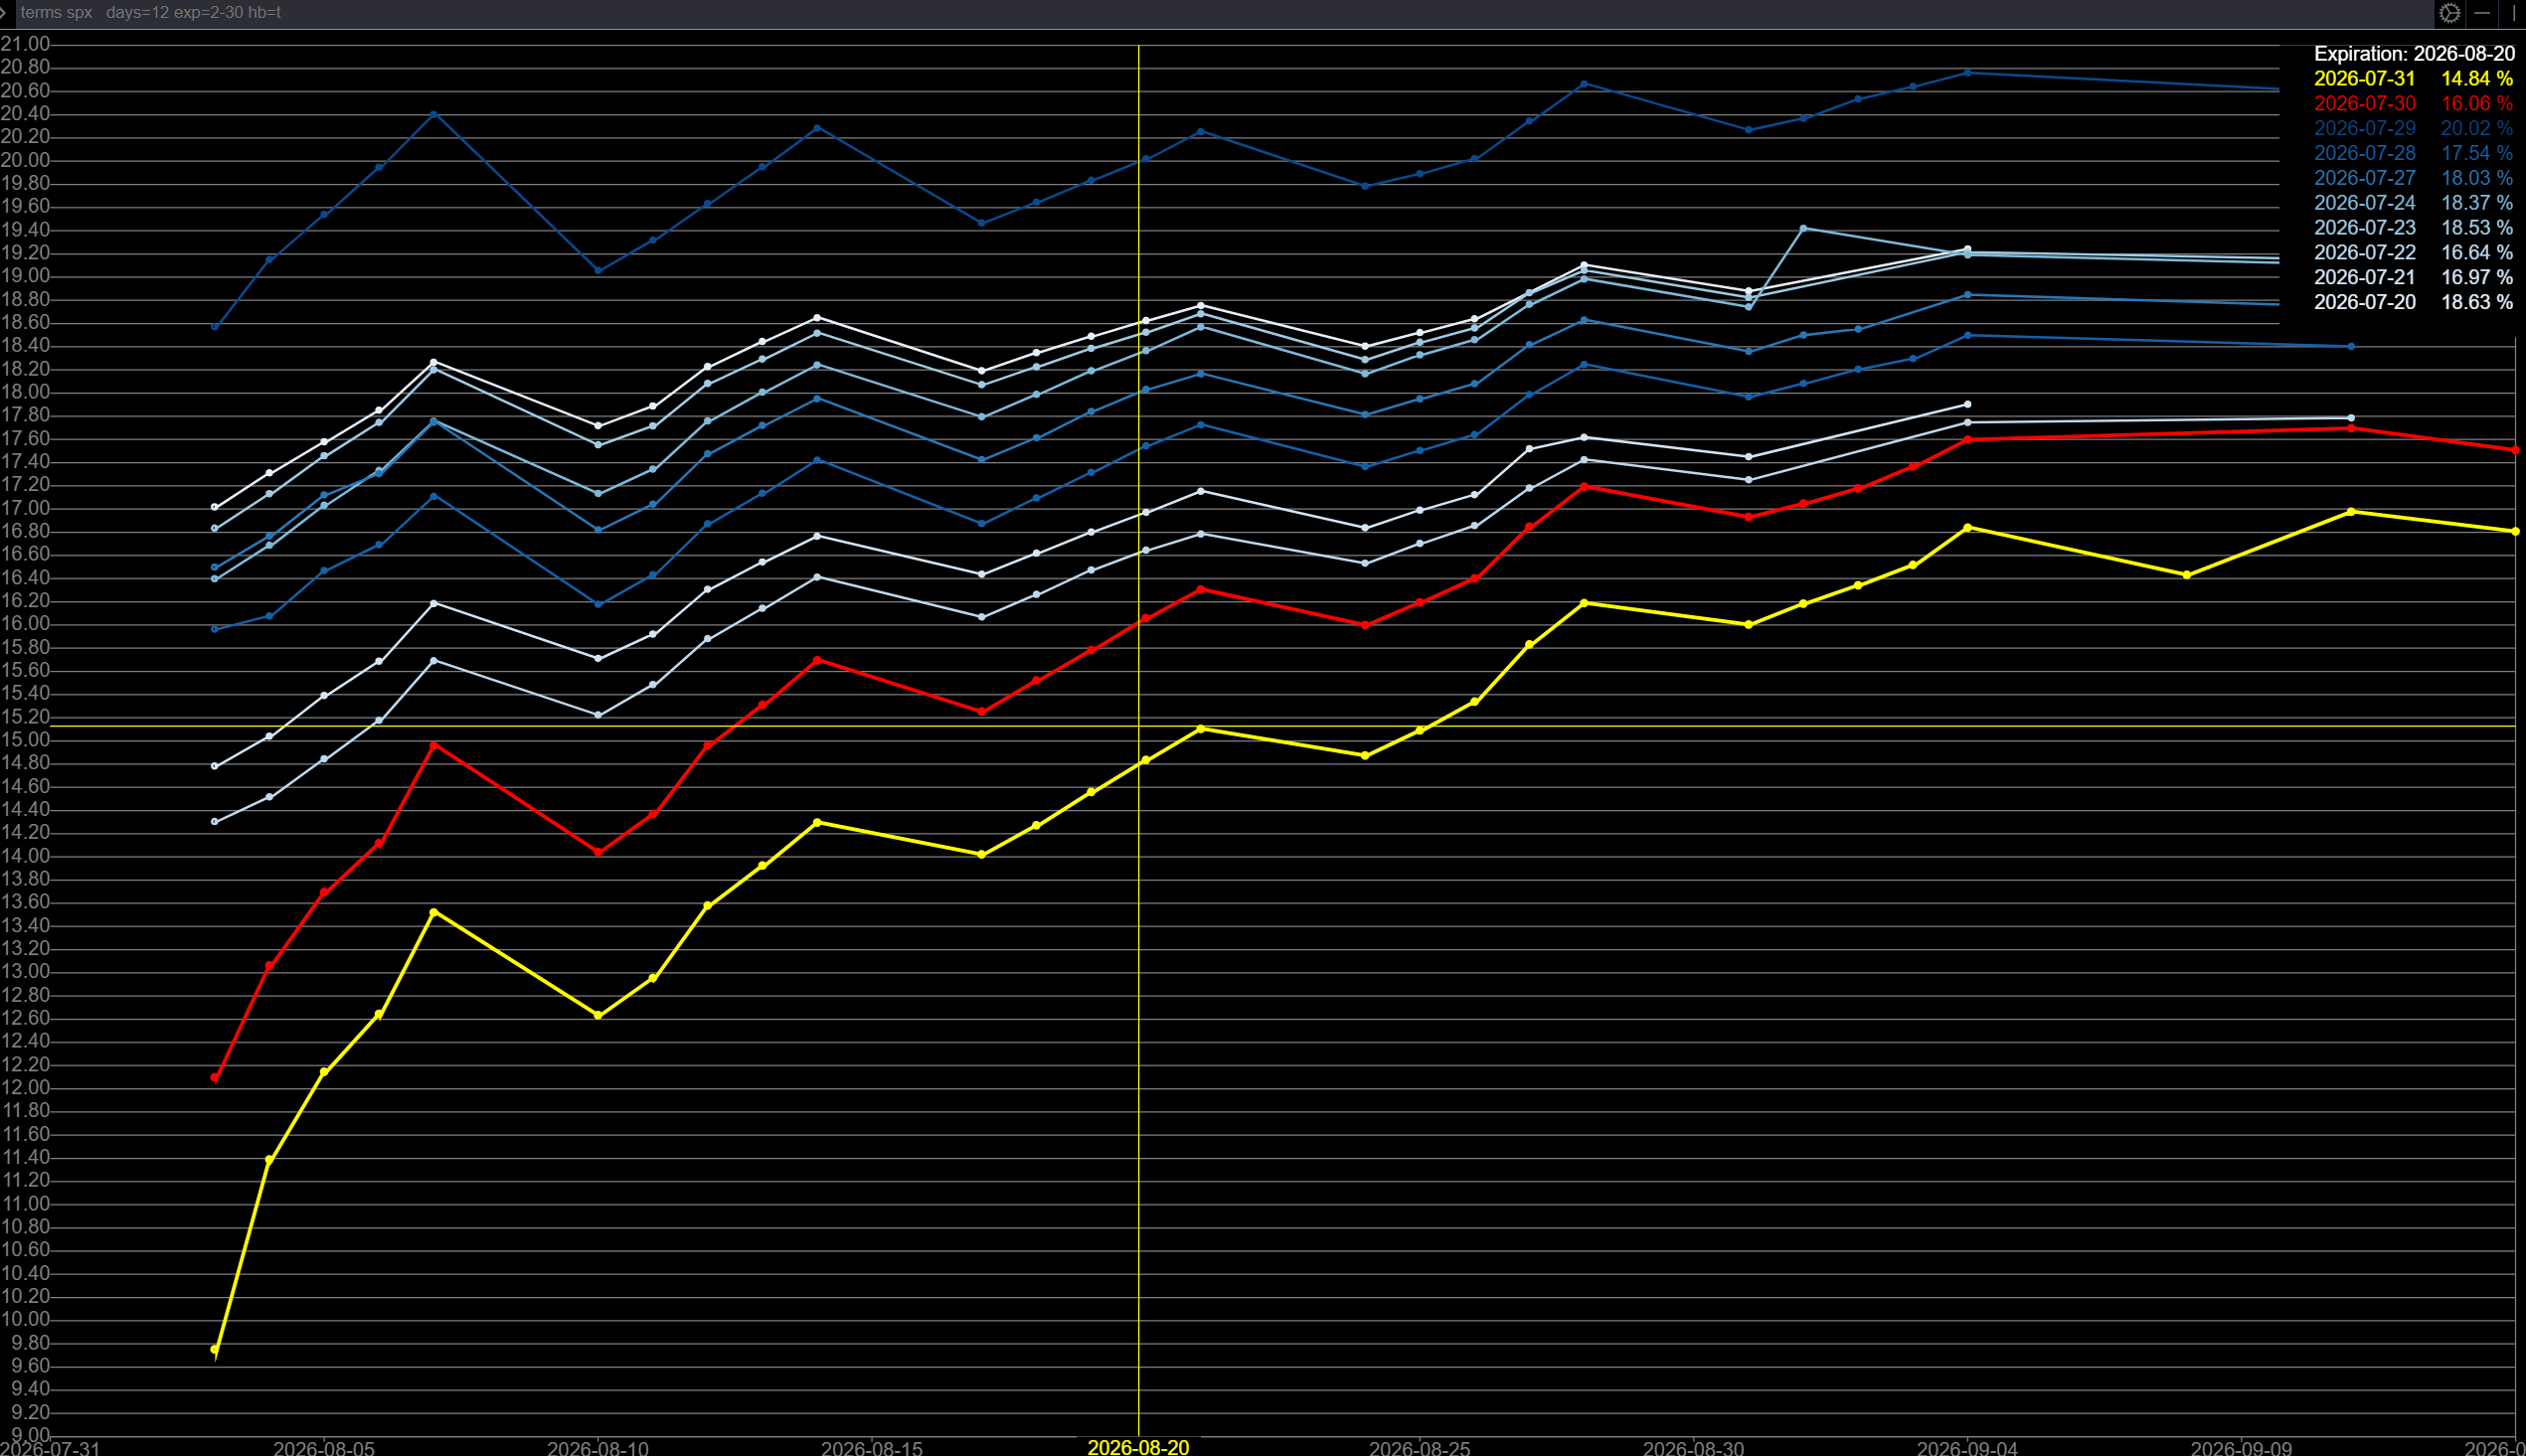
Term structure is back at the lows after earnings and FOMC have passed.
VIX Futures Curve
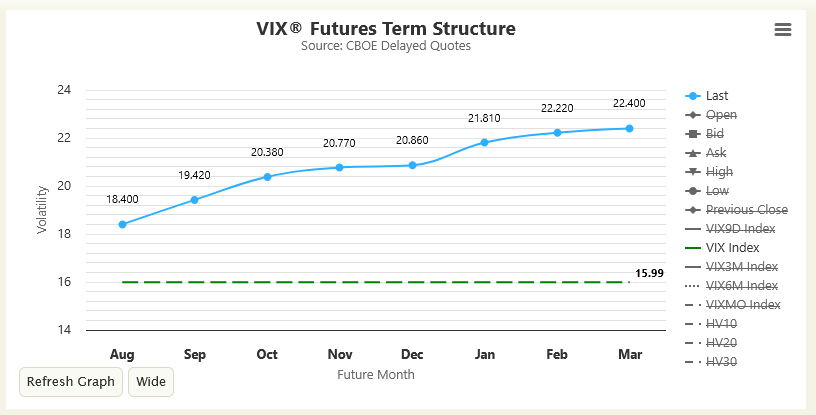
Curve looks fine - Until spot VOL is over front two months, we remain in a structurally BTD environment - If that happens, it’s a bit of a short the rip environment until it resolves.
Surface Models
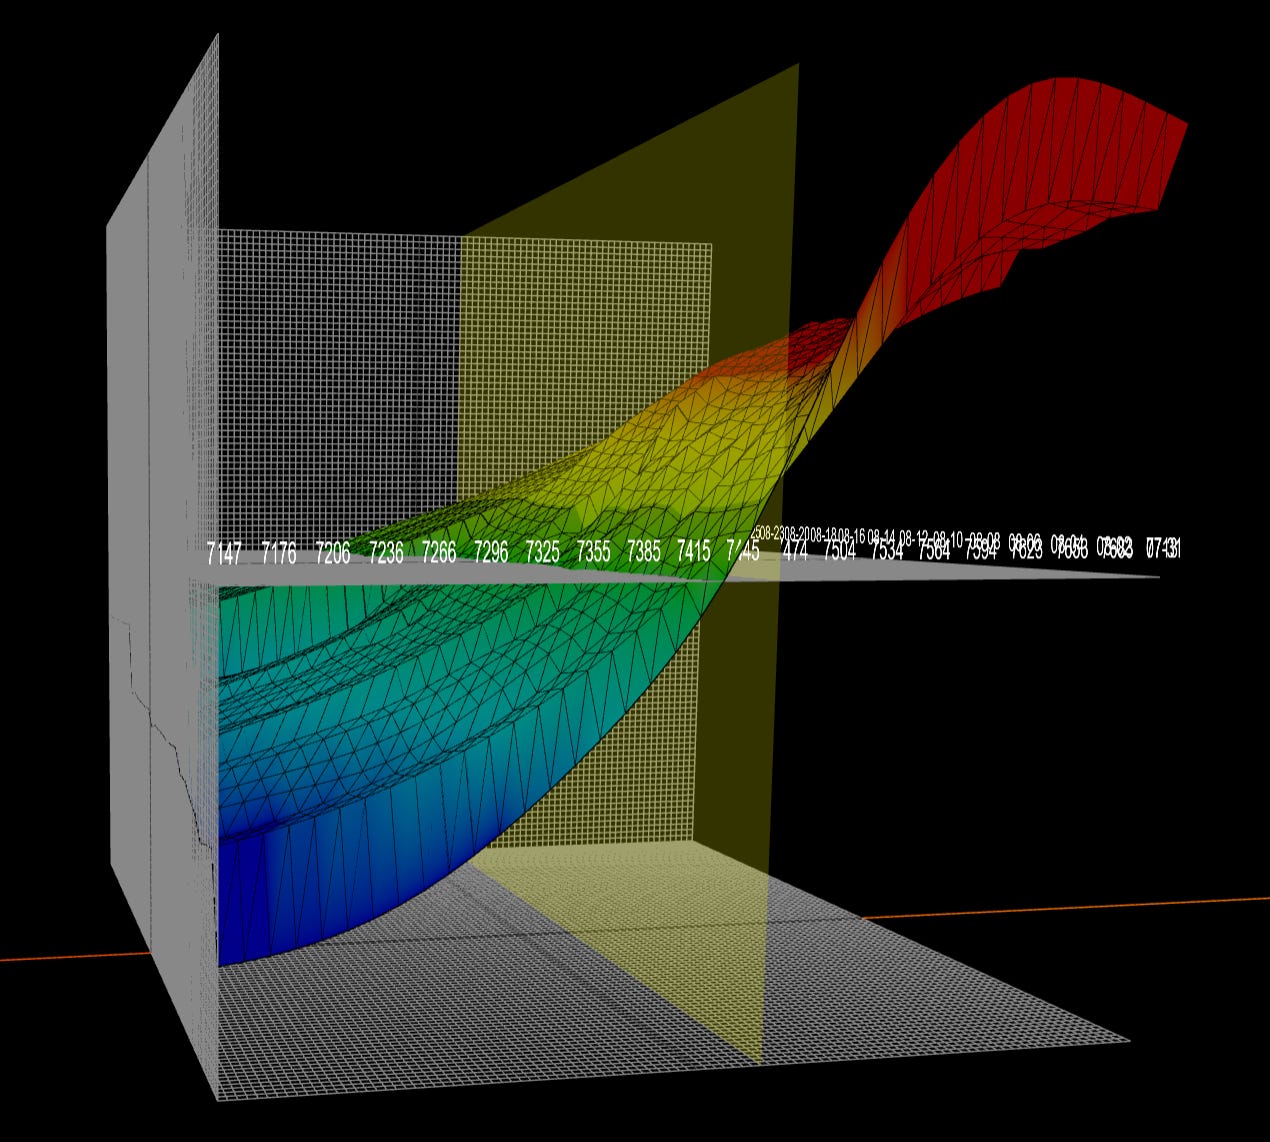
As of Friday morning, we’re well over the cumulative gamma flip in the market with a steep upside vic 7525.
Realized Volatility
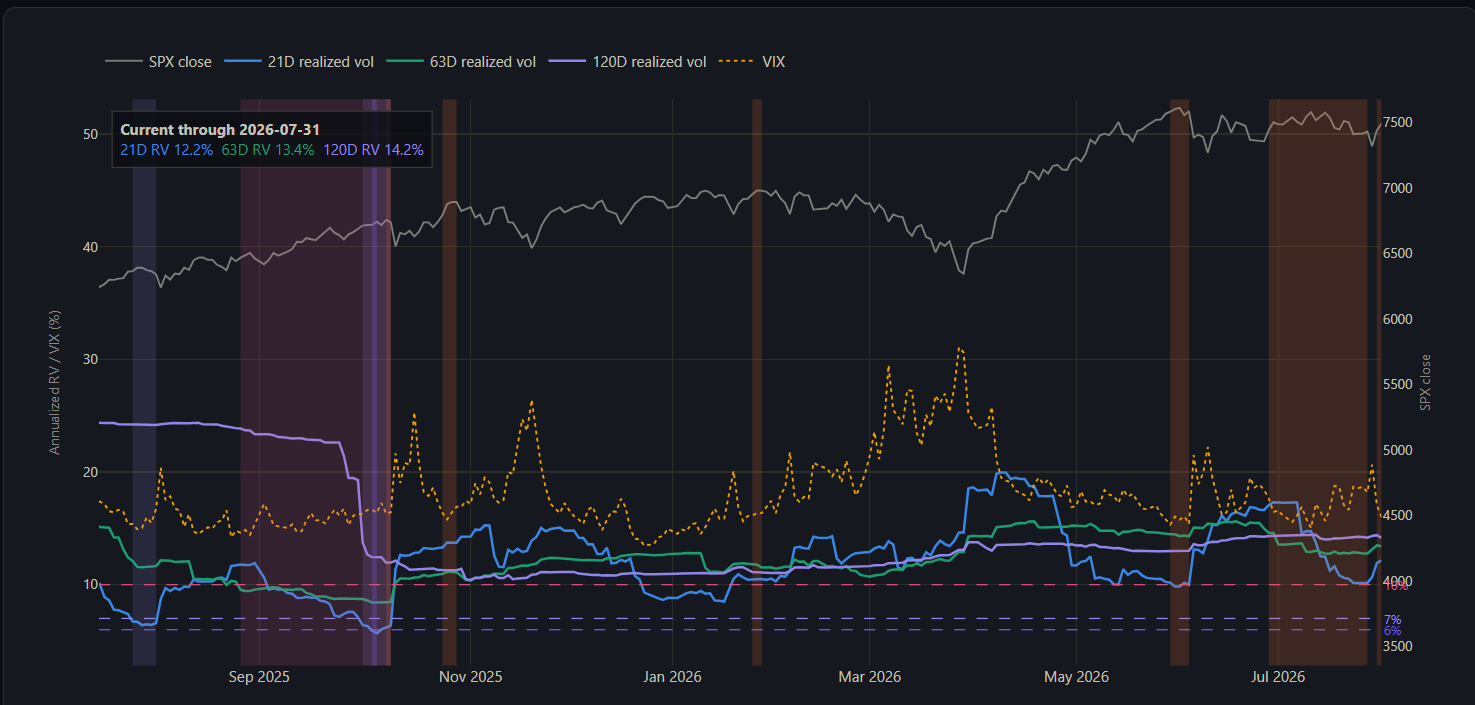
The major RV roll-off began on July 8th. An RV warning period opened on 07/08 and is officially over - from the time of triggering, market went up and peaked down 2.13% - closer to 3% a few days after it triggered.

How might it look for the 3 weeks
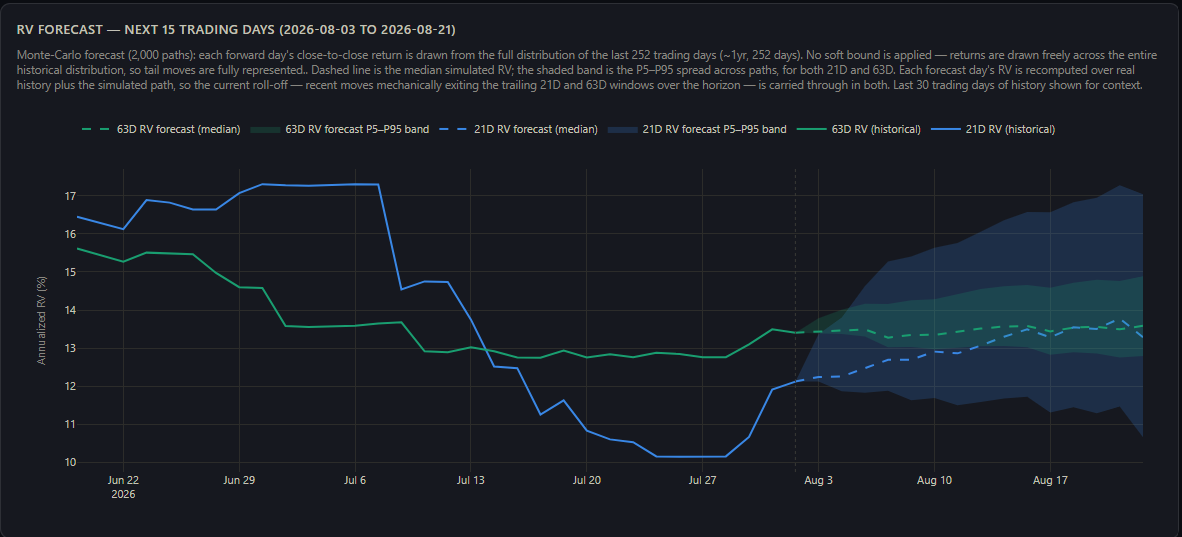
Why does this matter?
Systematics offload exposure into higher realized volatility
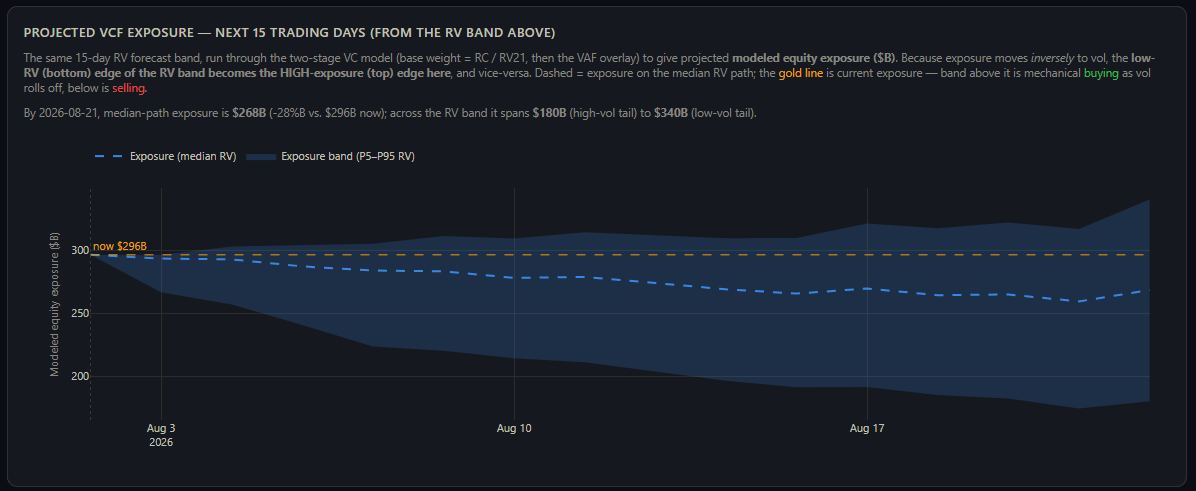
Is it going to cause us to crash - no… it just makes the market a bit more whipsaw in the event we get any selling.
SPX Net positioning (Aggregate)
Aggregate Through EOW
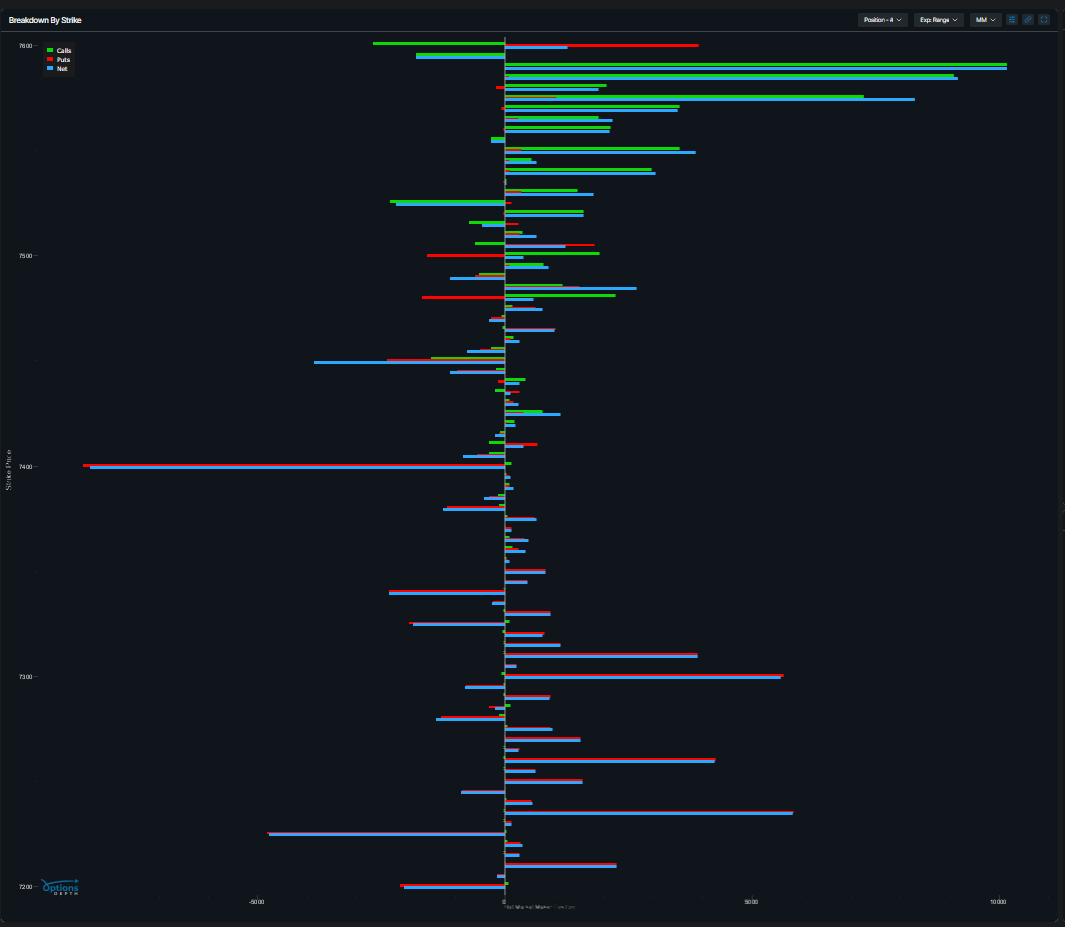
The snapshot above is from 7200 to 7600
How to read
Green: Calls
Blue: Puts
Red: Net
Left: Dealer Short (Market net bought)
Right: Dealer Long (Market Net sold)
What stands out the most to you?
Sold VOL at the extremes and bought VOL near the money - yay whipsaw days. See Green take green.
VIX Dealer Positioning
Left = Upcoming Weekly
Middle = Following Week
Right = AUG VIXEX

What stands out?
How about the extremely large VIX 17P position for Wednesday - BTW I mentioned this on twitter and mentioned it doubled in size that day - these contracts went from .15 to ITM now.
If you would like your own OptionsDepth Account and think my overviews are valuable, please consider using this referral link:
https://optionsdepth.com/app?via=Yamco
Technical Structure of the market (breadth)
Advance Decline Line
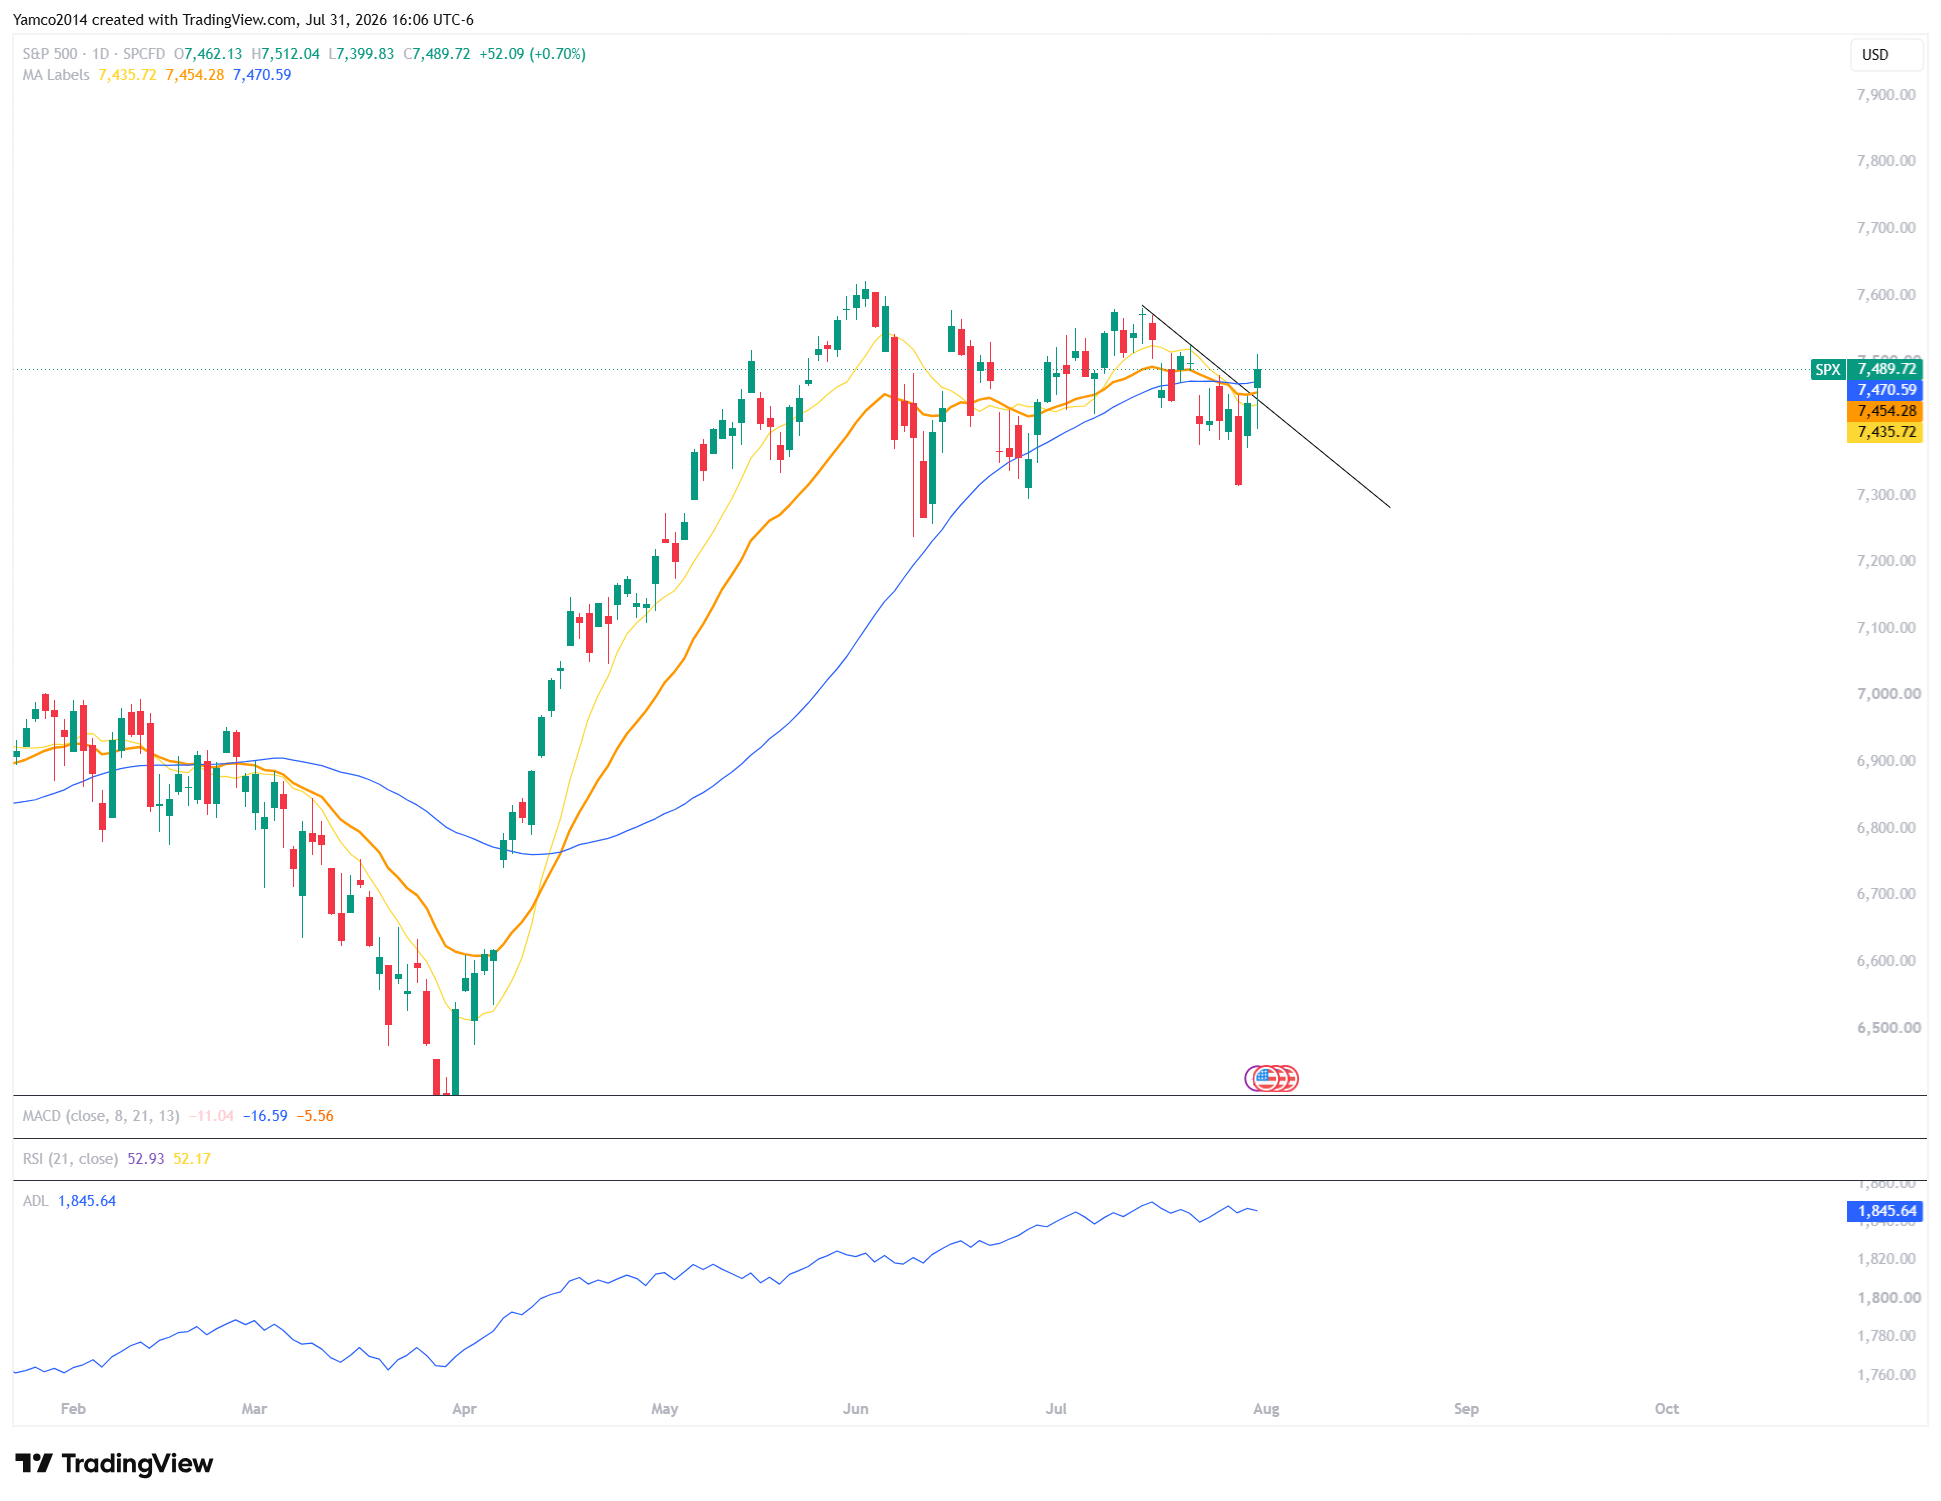
Short term, the ADL is at highs while SPX reclaimed all major moving averages. Any dips should be bought as long as the VOL Curve remains healthy. I’d imagine this next week we get a test vic 7400 (Maybe down to 7367-7387) and it’s buyable unless something changes.
Percentage of SP stocks over moving averages
5 Day - SF5D
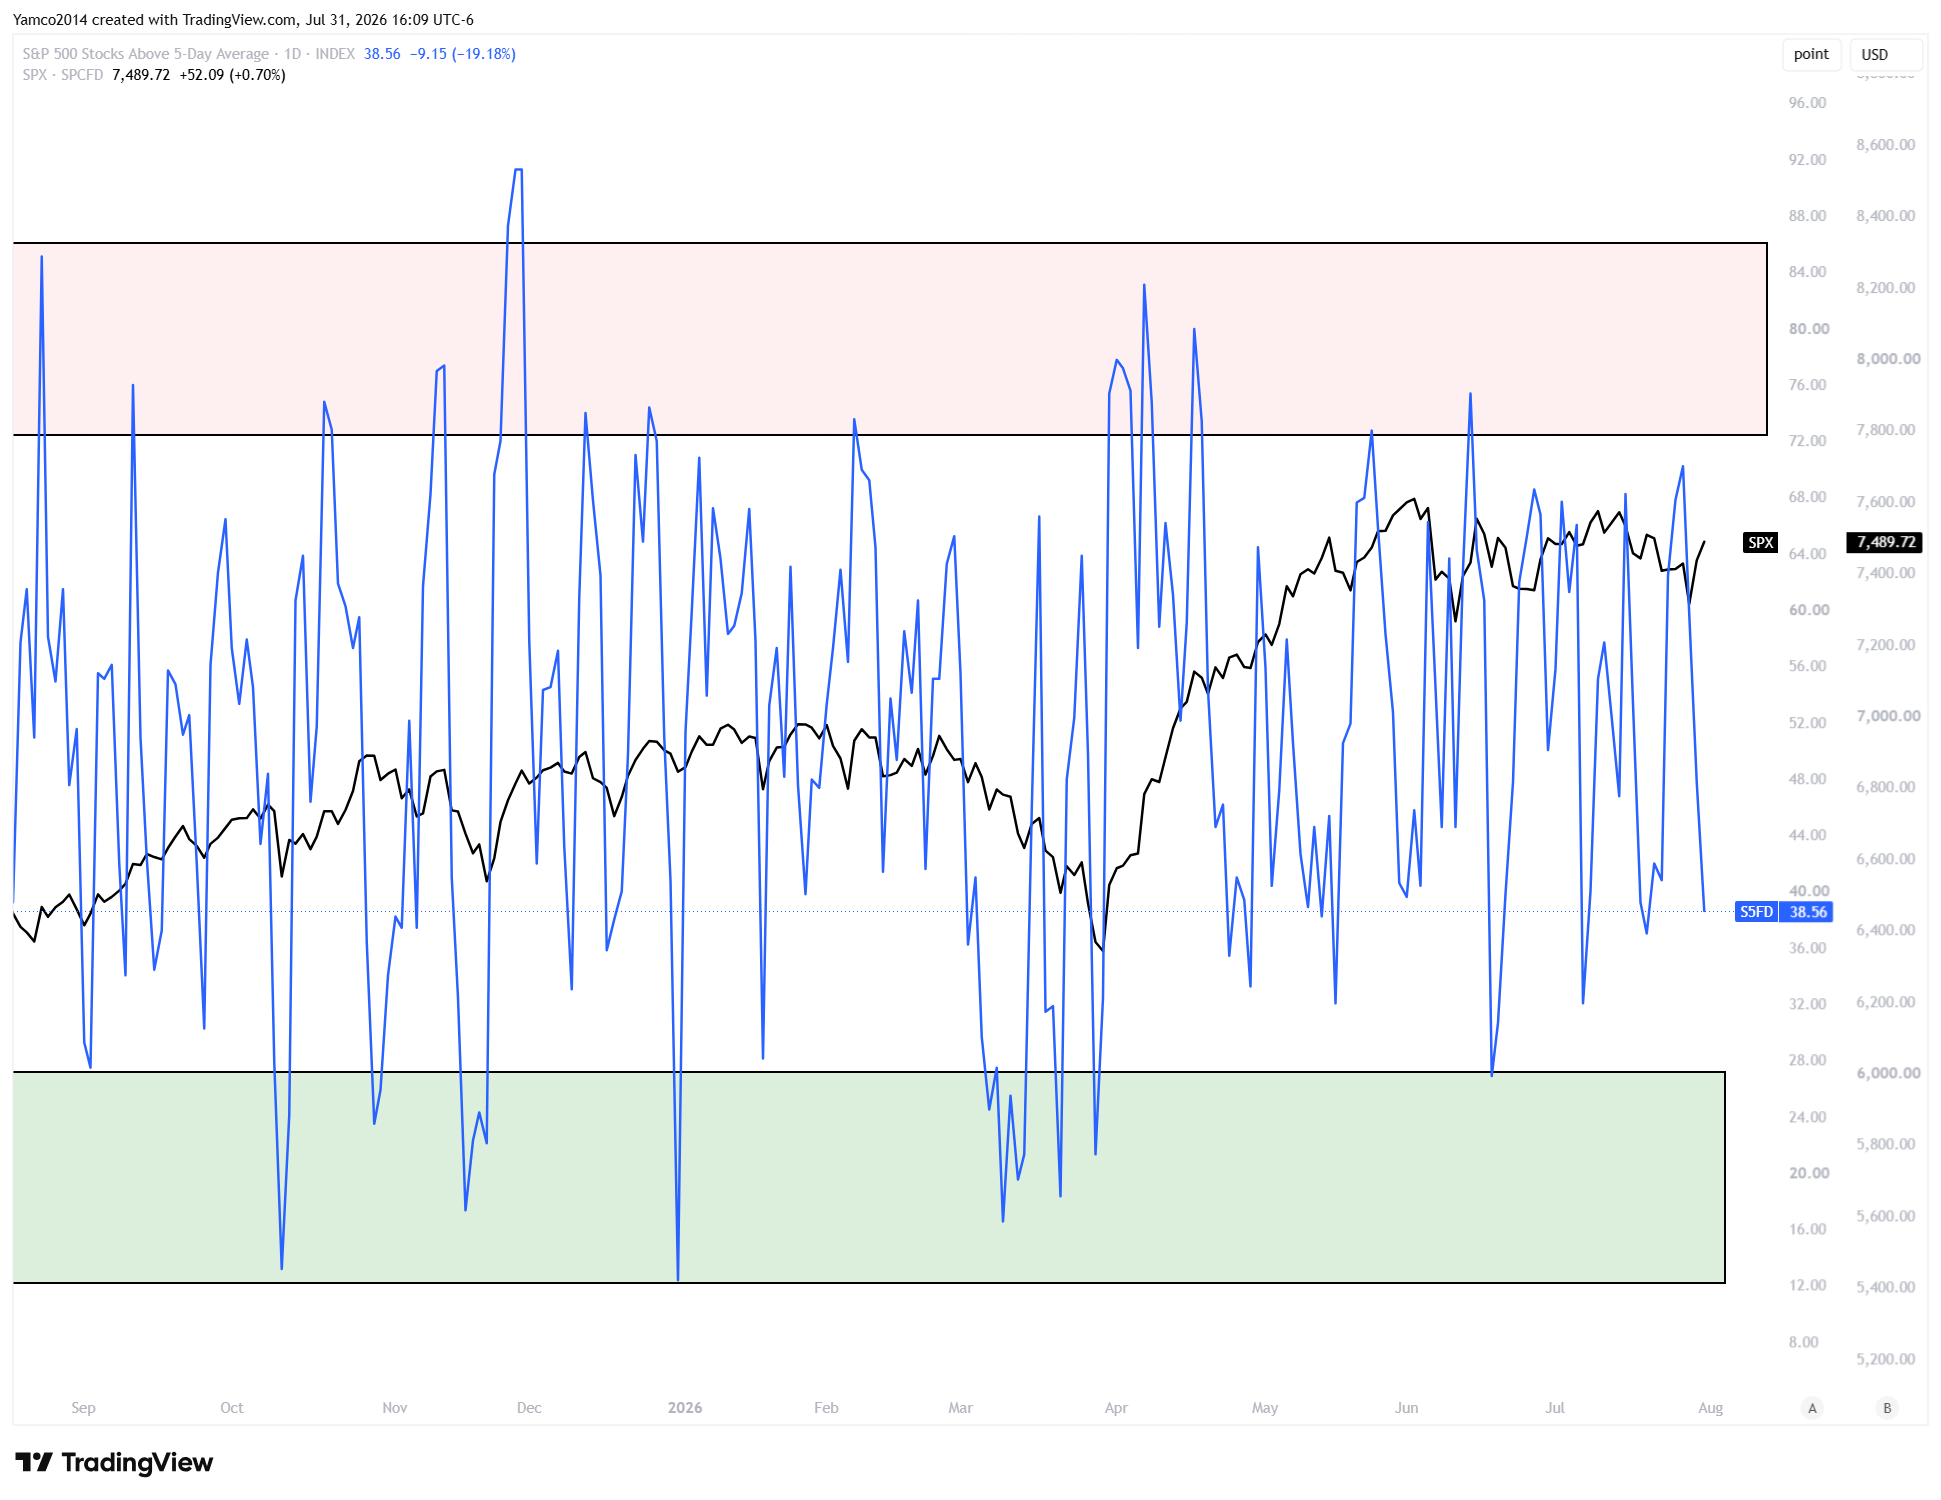
This metric tracks the percentage of SP500 stocks above their relative 5-Day moving average - It’s in the middle of the range and is violently chopping around
How to Read
Blue Line = S5FD
Black Line = SPX
Green Box = S5FD from 15-30
Red Box = SF5D from 70-90
Your eyes should pick up on the oversold/overbought conditions when S5FD reaches extremes - does it always work - depends what you think about wobbles and corrections in time. There’s nothing in short term with signal since Tech isn’t participating. I’m watching the tech ones like NDFI and NDFD,
5 Day - NDFD
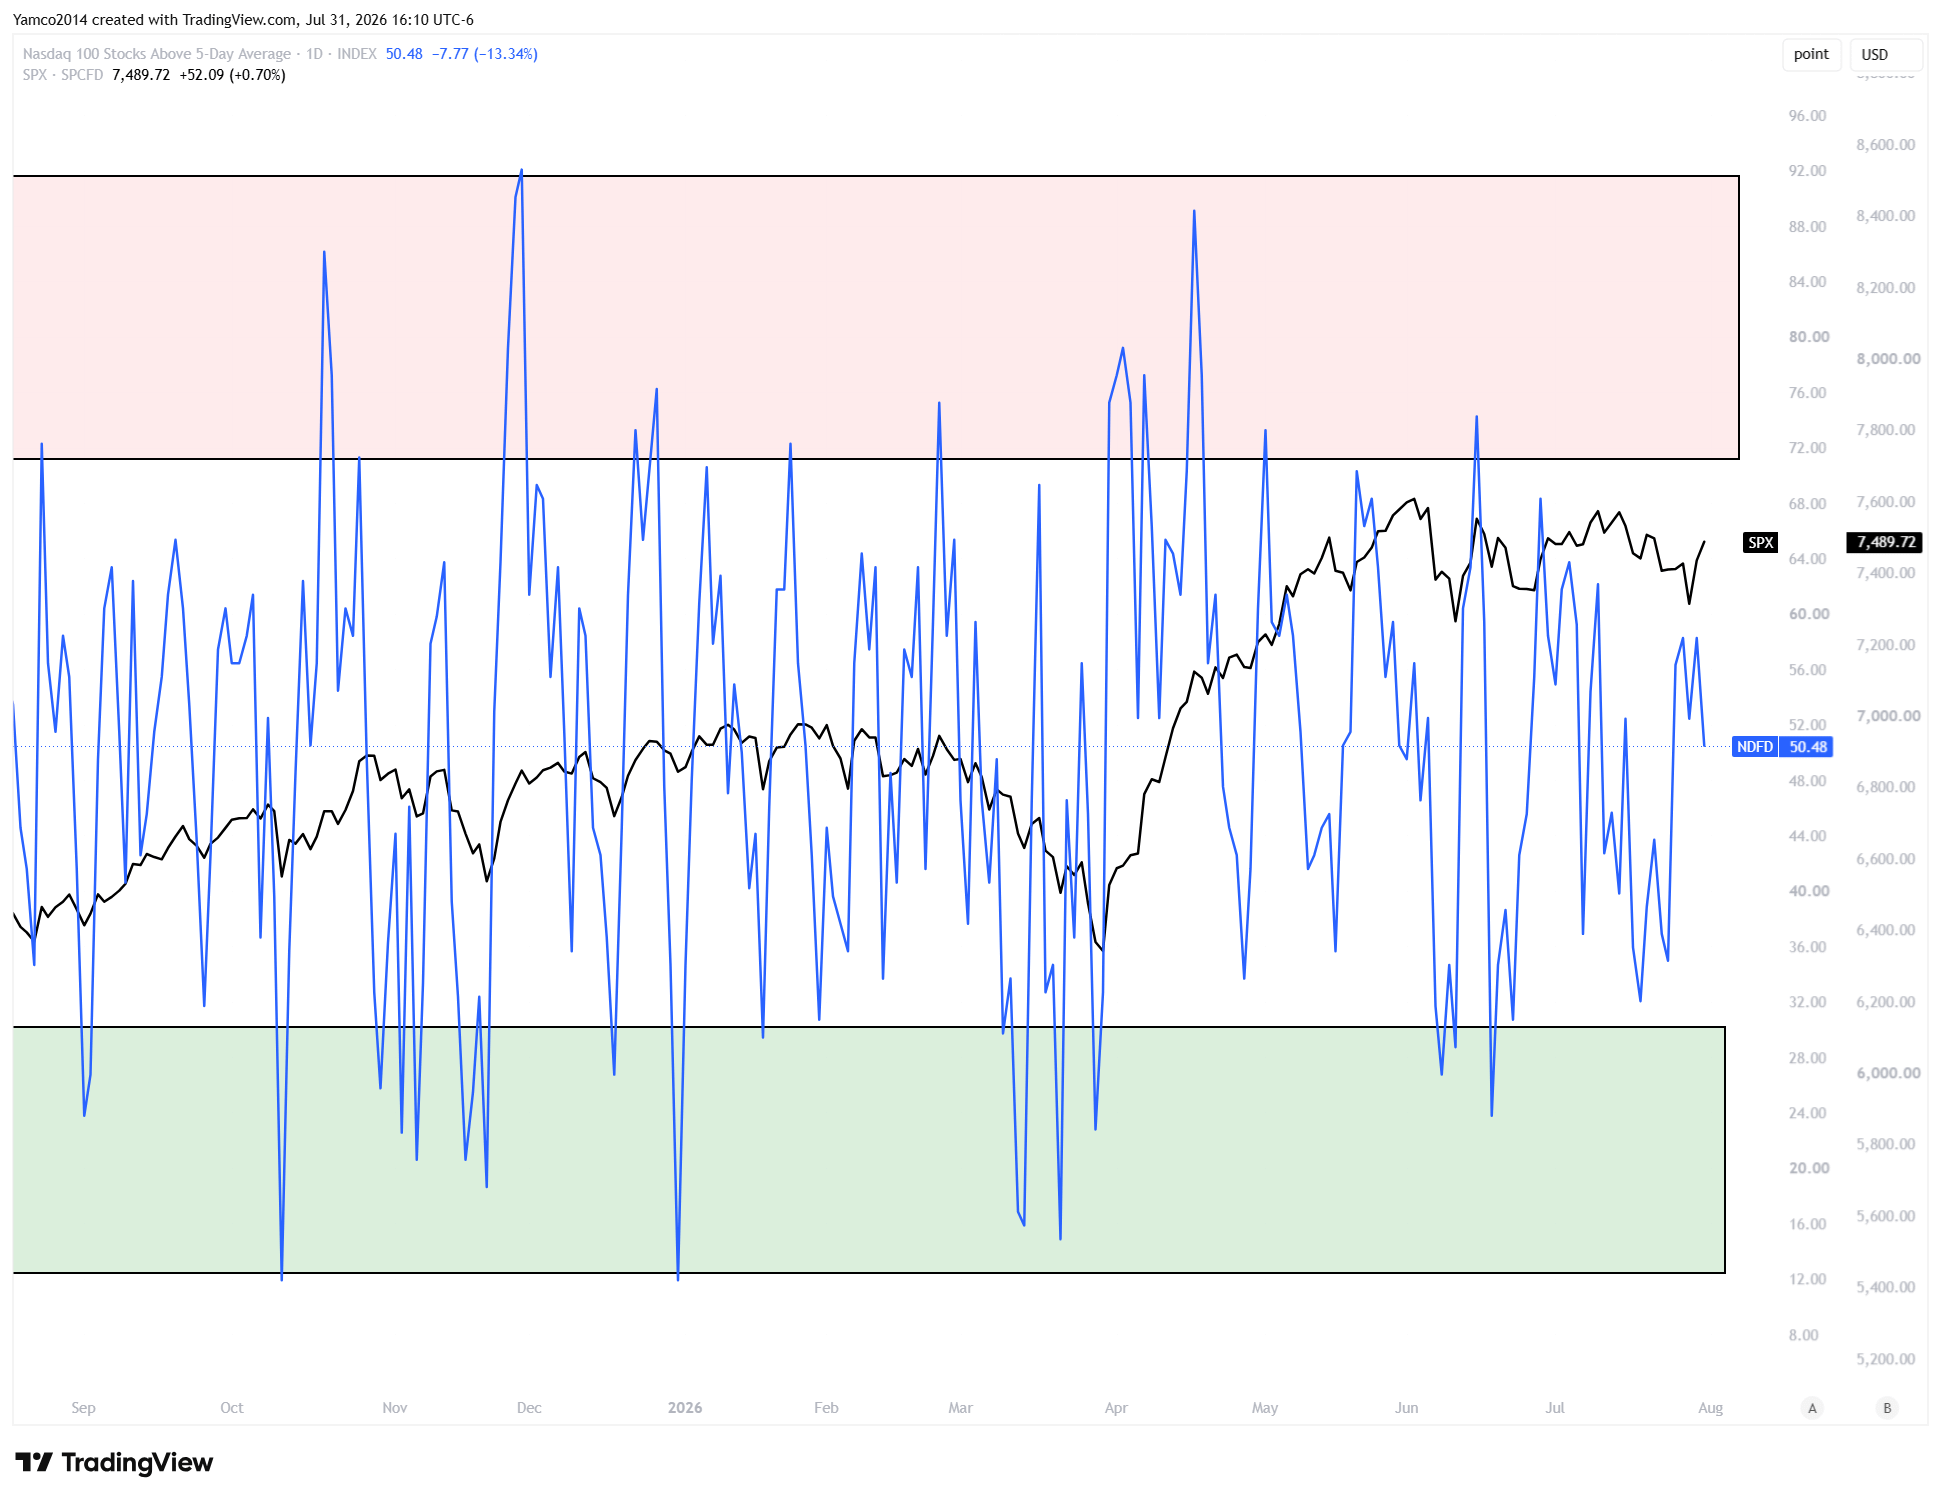
This metric tracks the percentage of Nasdaq 100 stocks above their relative 5-Day moving average - It’s in the middle of the range and is violently chopping around
How to Read
Blue Line = NDFD
Black Line = SPX
Green Box = NDFD from 12.5-30
Red Box = NDFD from 70-90
Sentiment
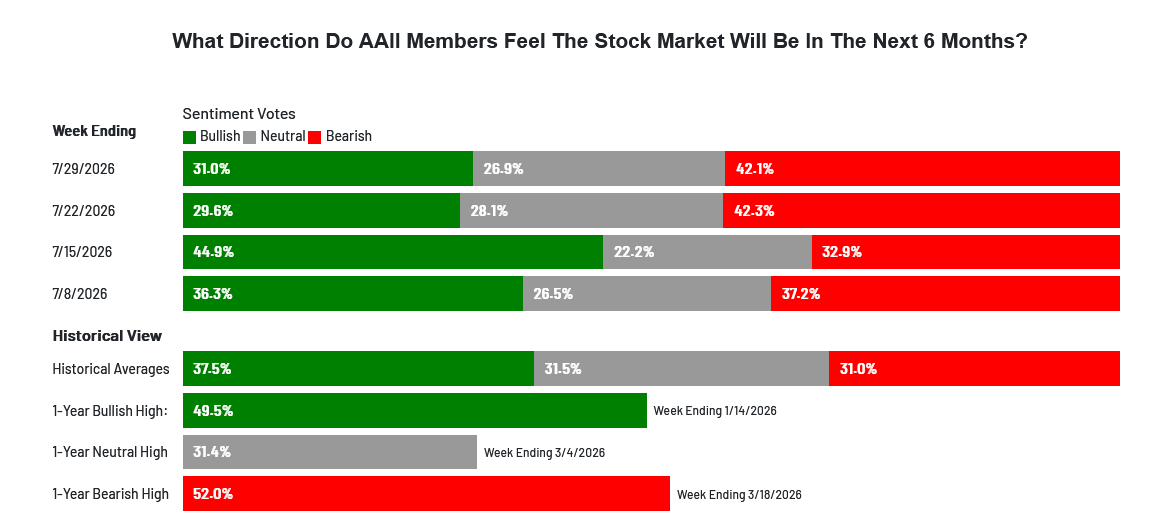
This data is of Thursday but I mentioned last week that when this gets to bearish extremes, we get a pop…

AAII is released on Thursday mornings
As of Thursday morning, investors are bearish (I’m sure it’s full switched to bull by now).
Metals (Silver/Gold)
SLV 0.00%↑ (using Front Month Silver Futures)
Monthly scale
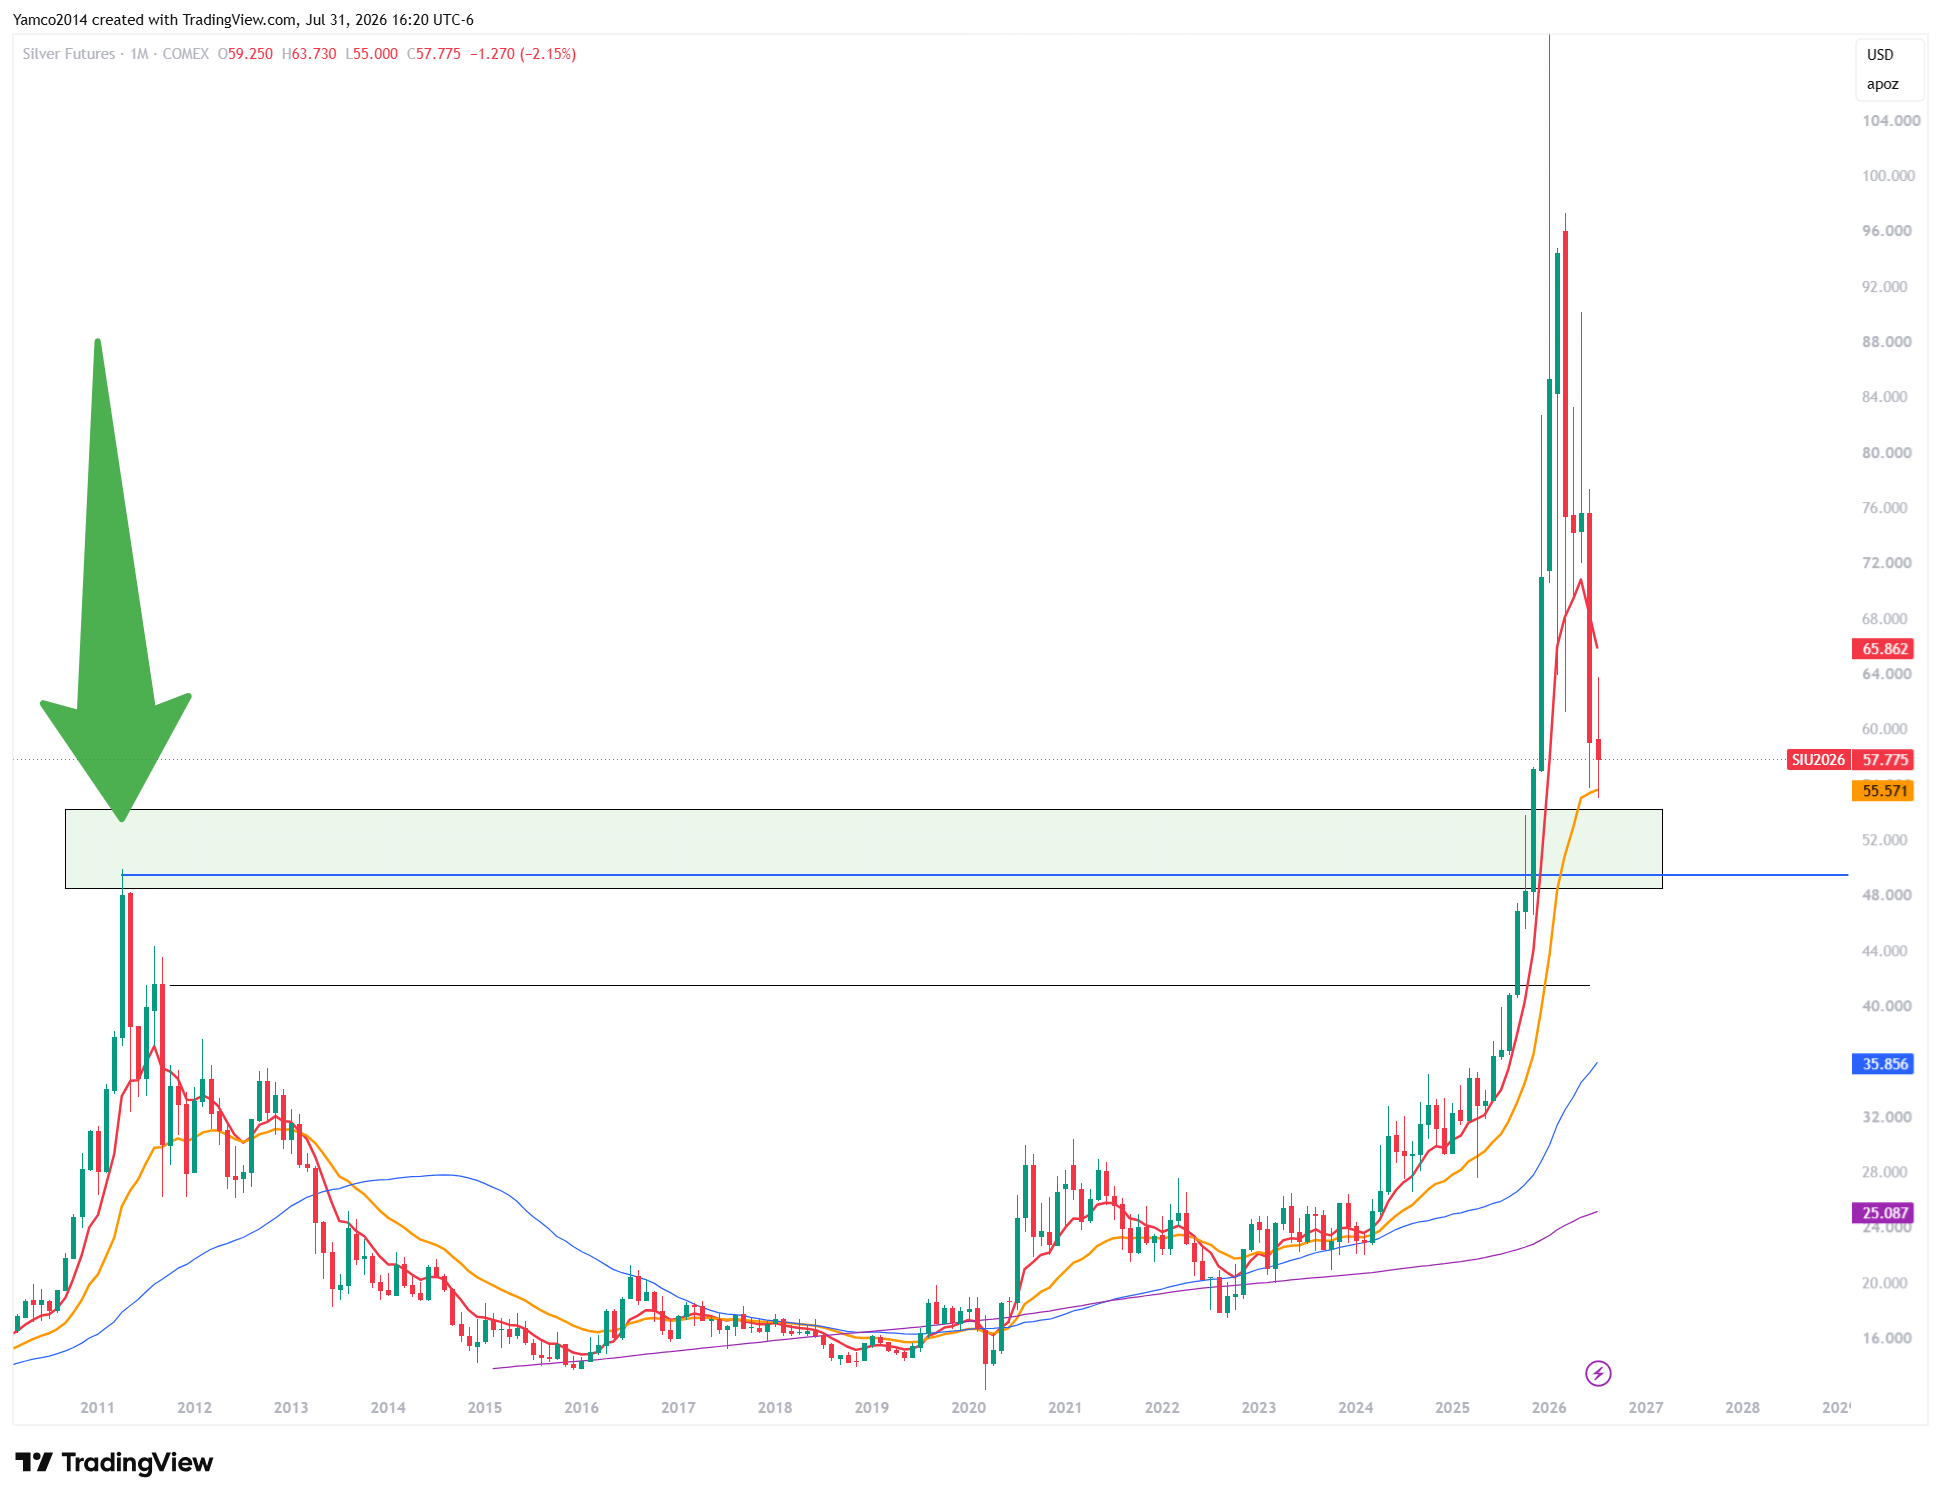
I think technically, the 2011 highs area is a buy zone - markets often have memory and if offered, it could be a nice spot to try.
Weekly scale zoomed in
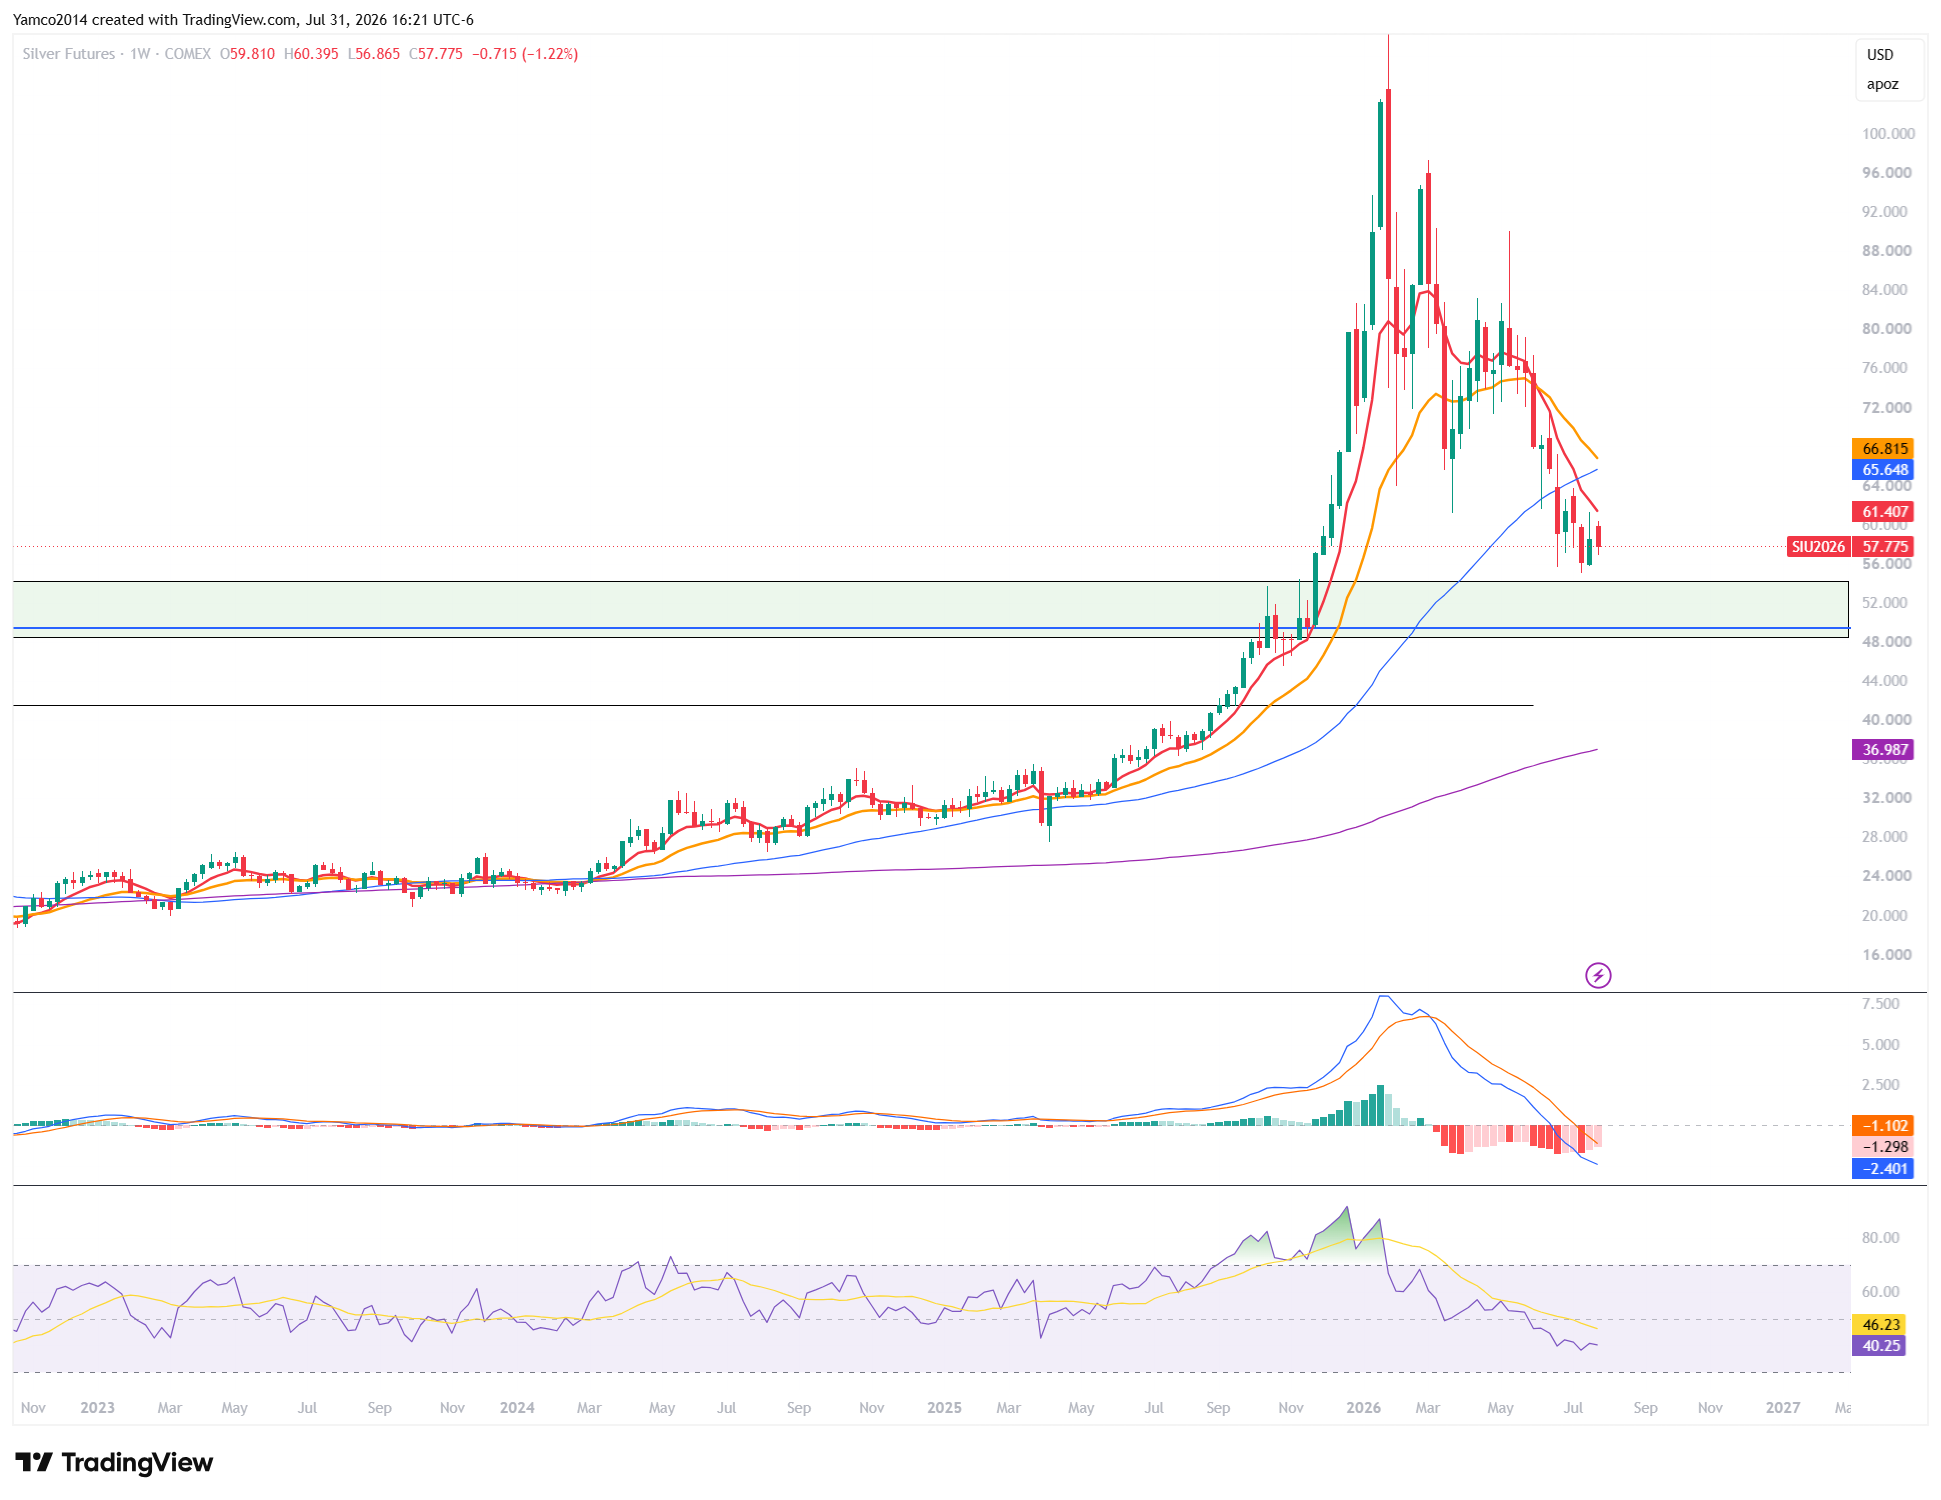
FOMC this week can illicit a sharp move (direction - no clue!). I favor a sharp move down to that blue line to build exposure into 2028.
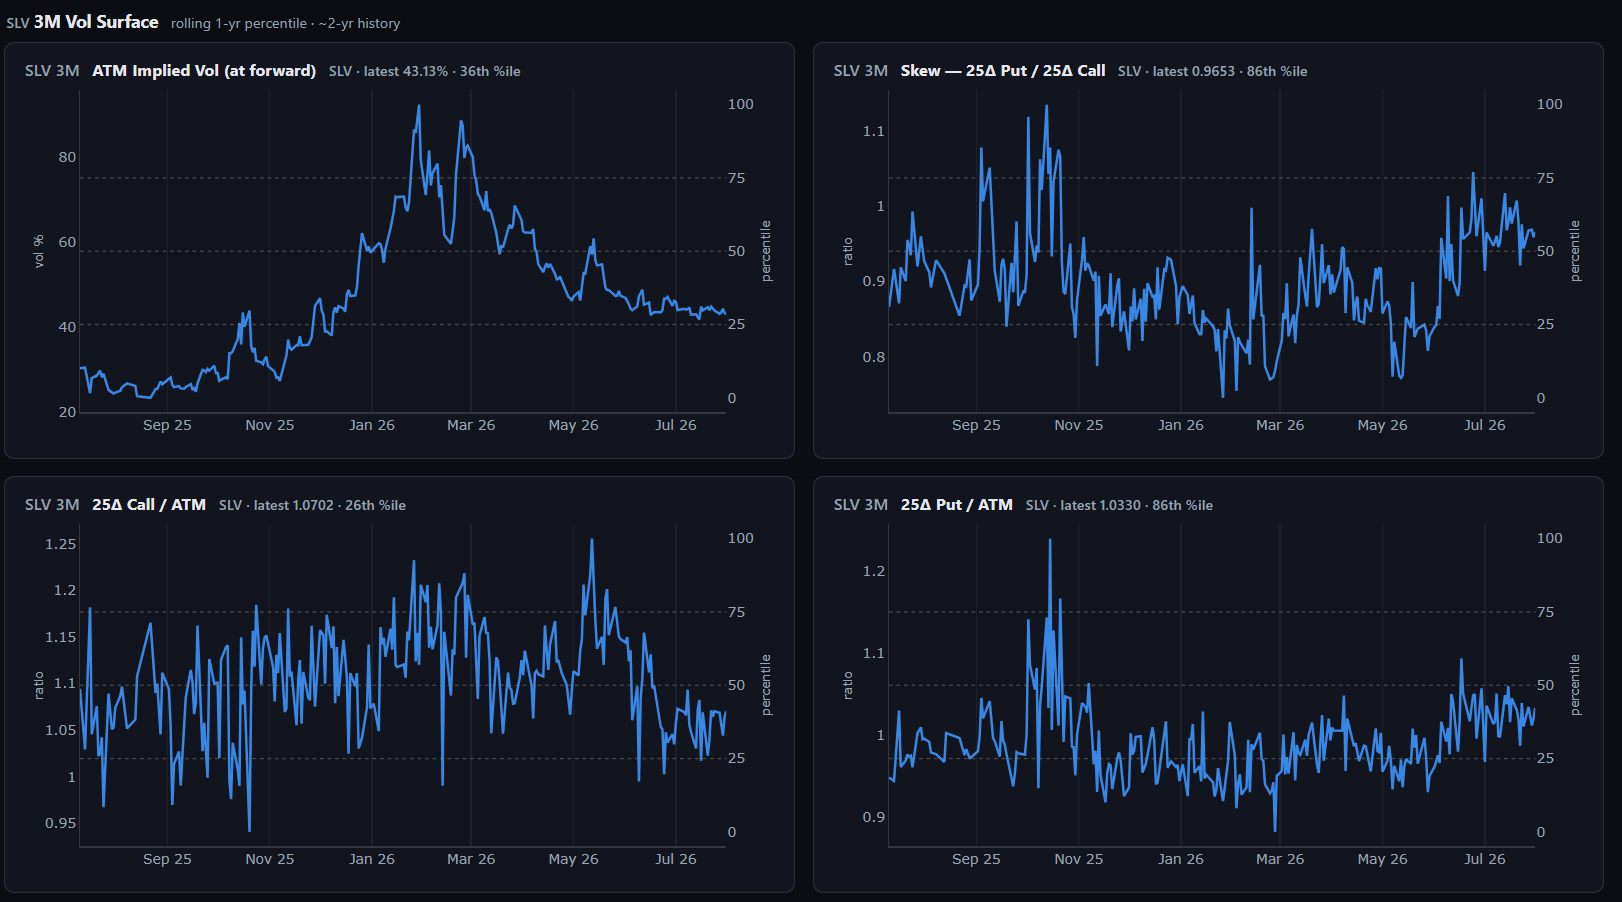
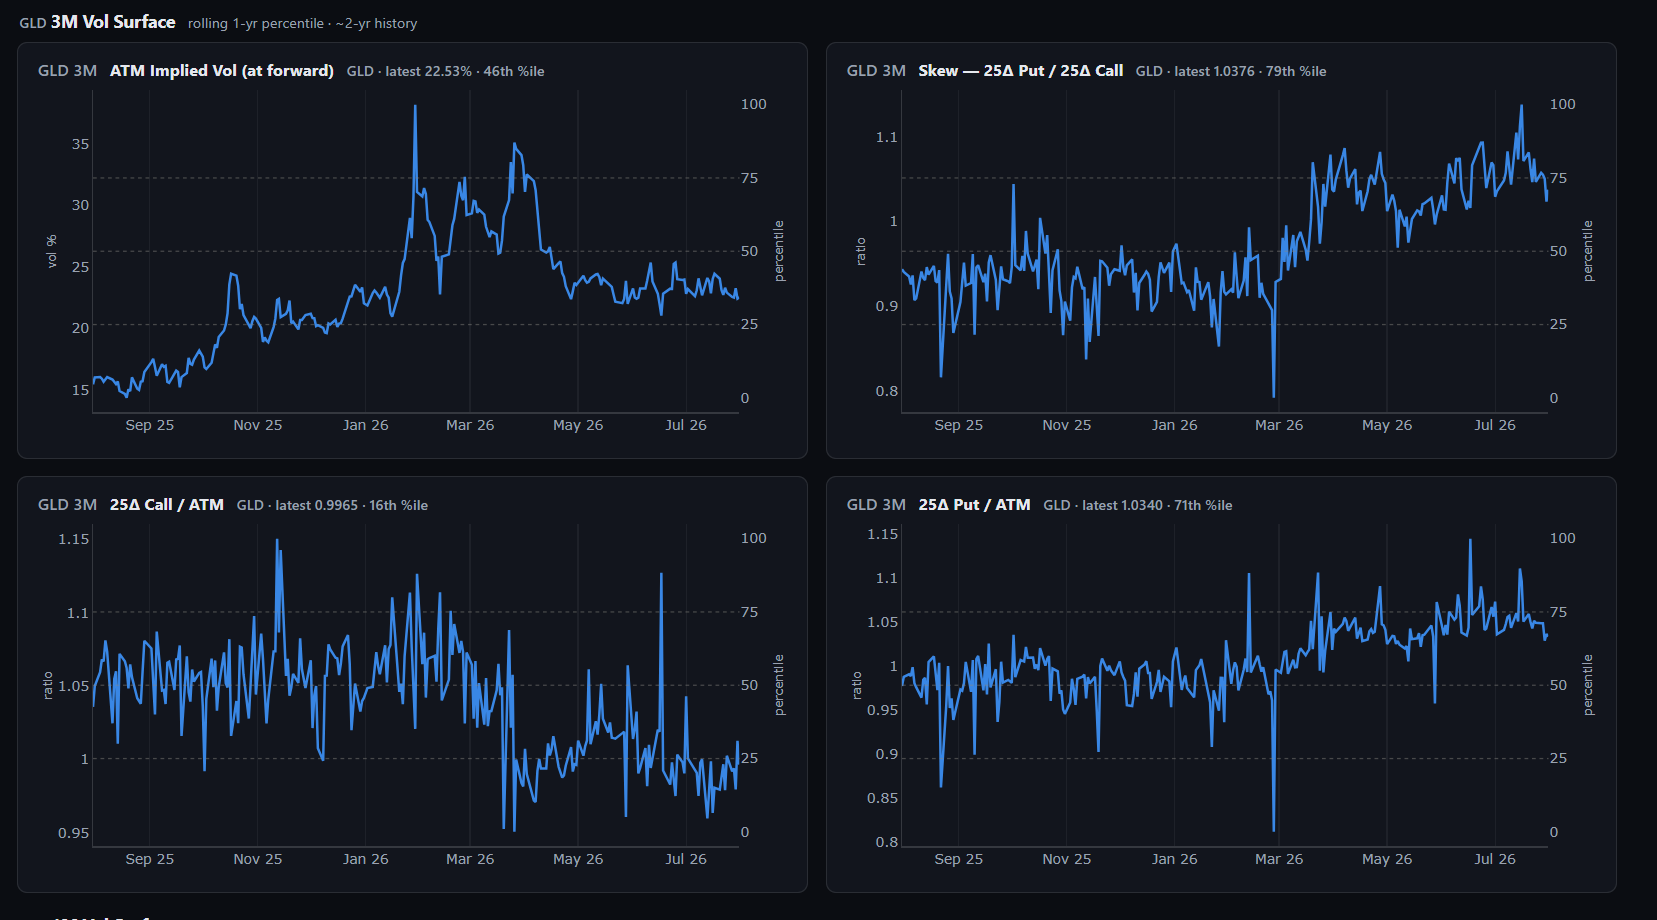
Forward Skew
Puts are still more expensive relative to calls and ATM IV - One last push down in GLD on the backs of macro and then it’s go time (It might have bottomed already fwiw).
GLD 0.00%↑ (Using Front month Gold Futures)
Weekly
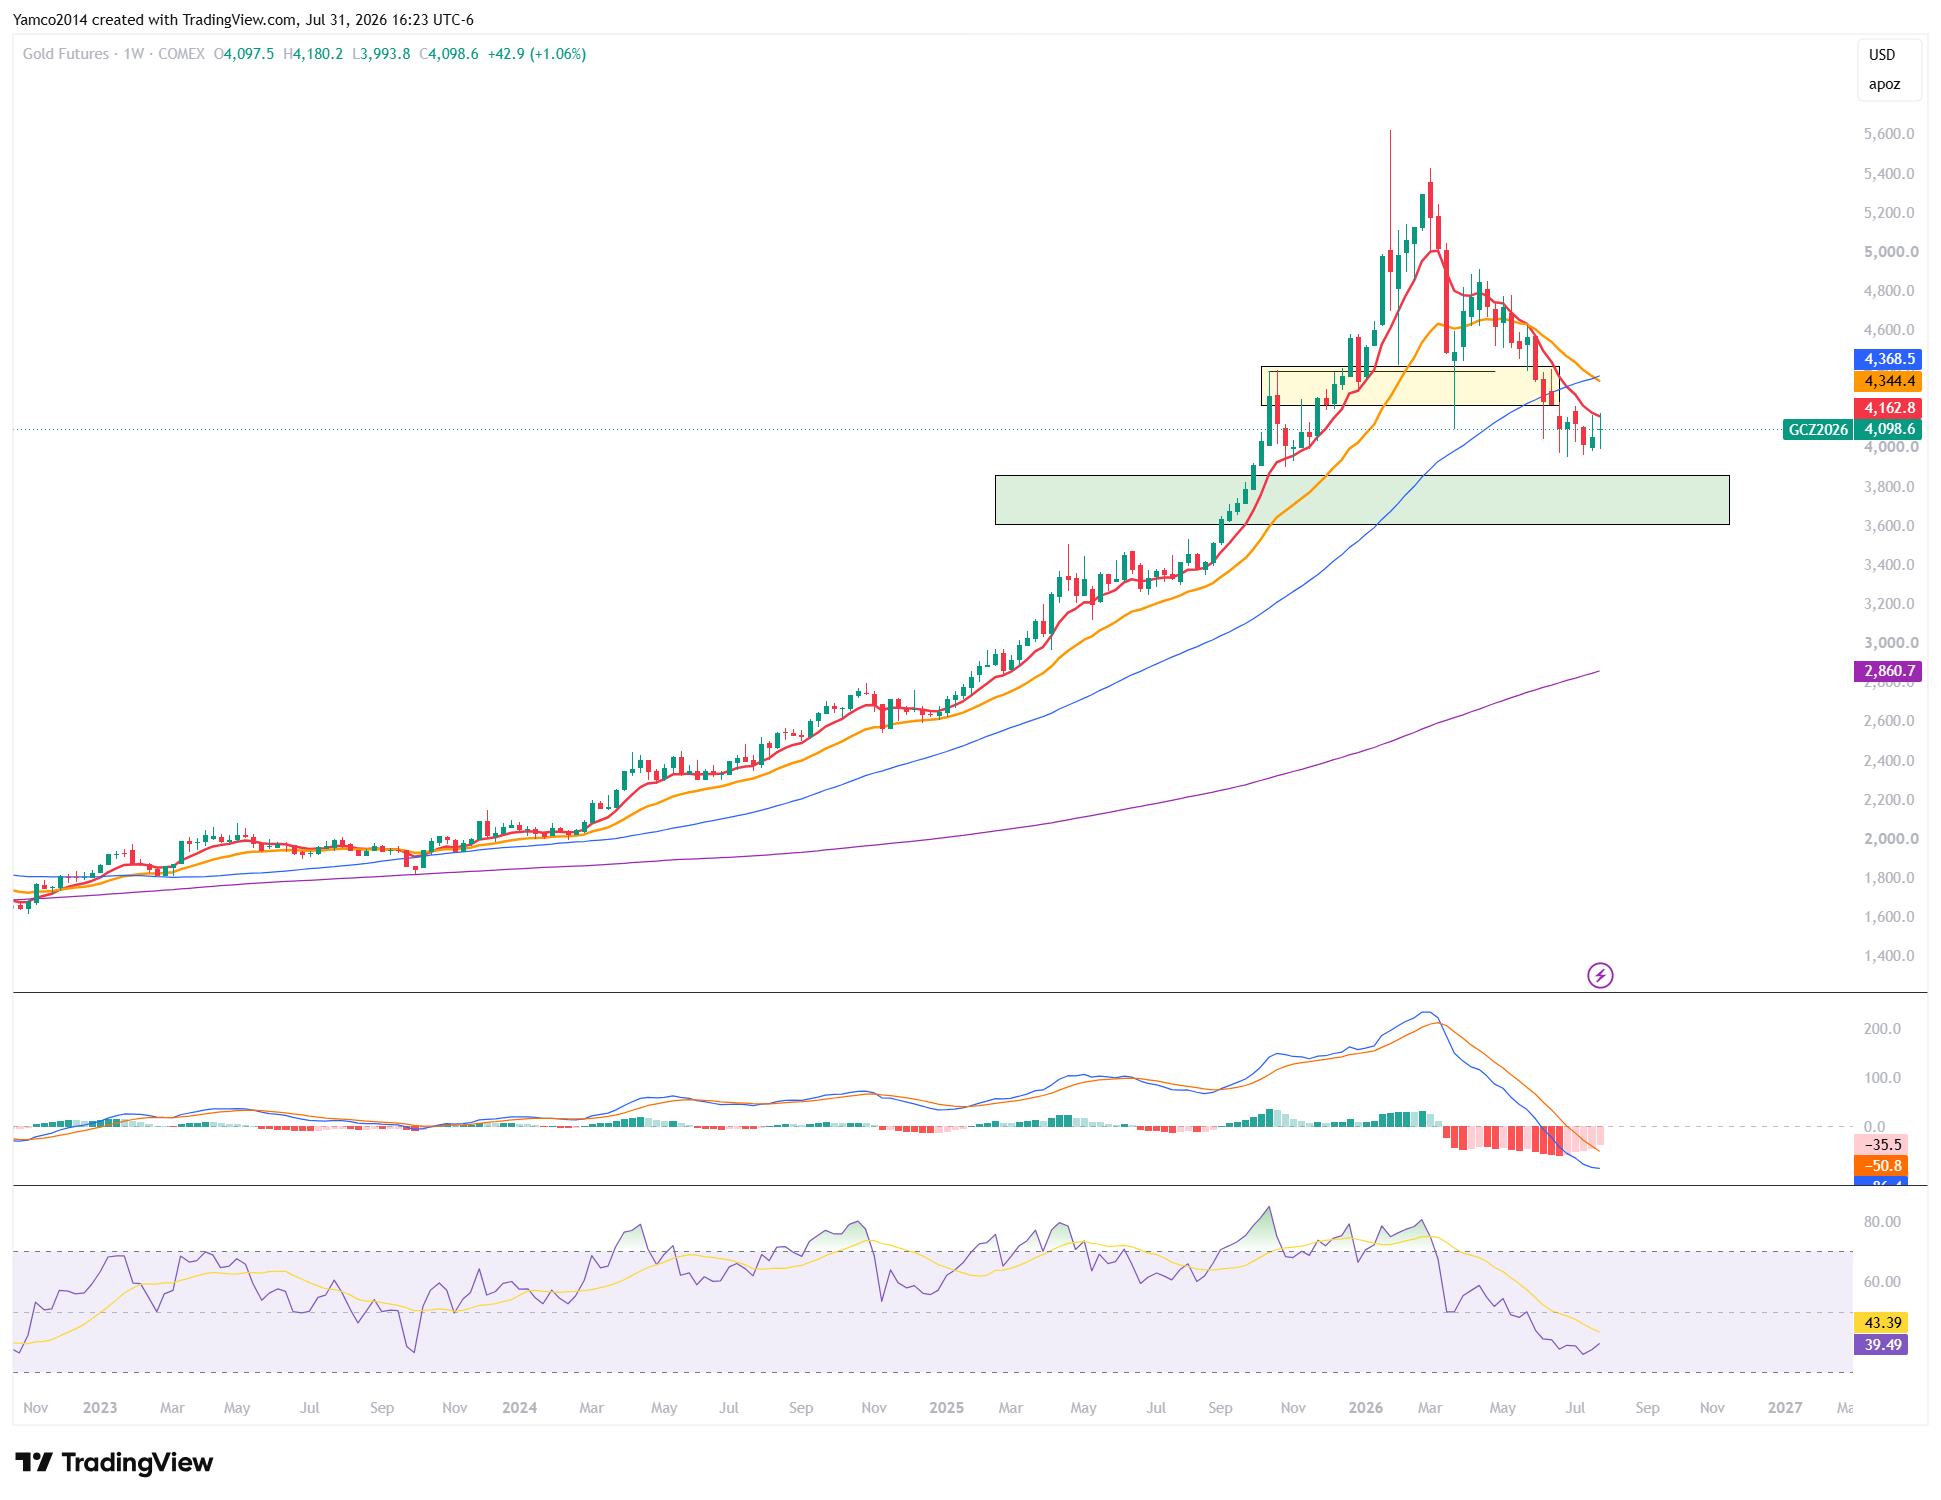
MACD looking like a bottom is possible but still no clear signal.
Forward Skew
Calls are starting to inflect while puts are high IV still relative to ATM vol - you would ideally want to see ATM vol drop a bit lower and put IV to spike up a bit - something happens in MACRO land to drive these down for one last push.
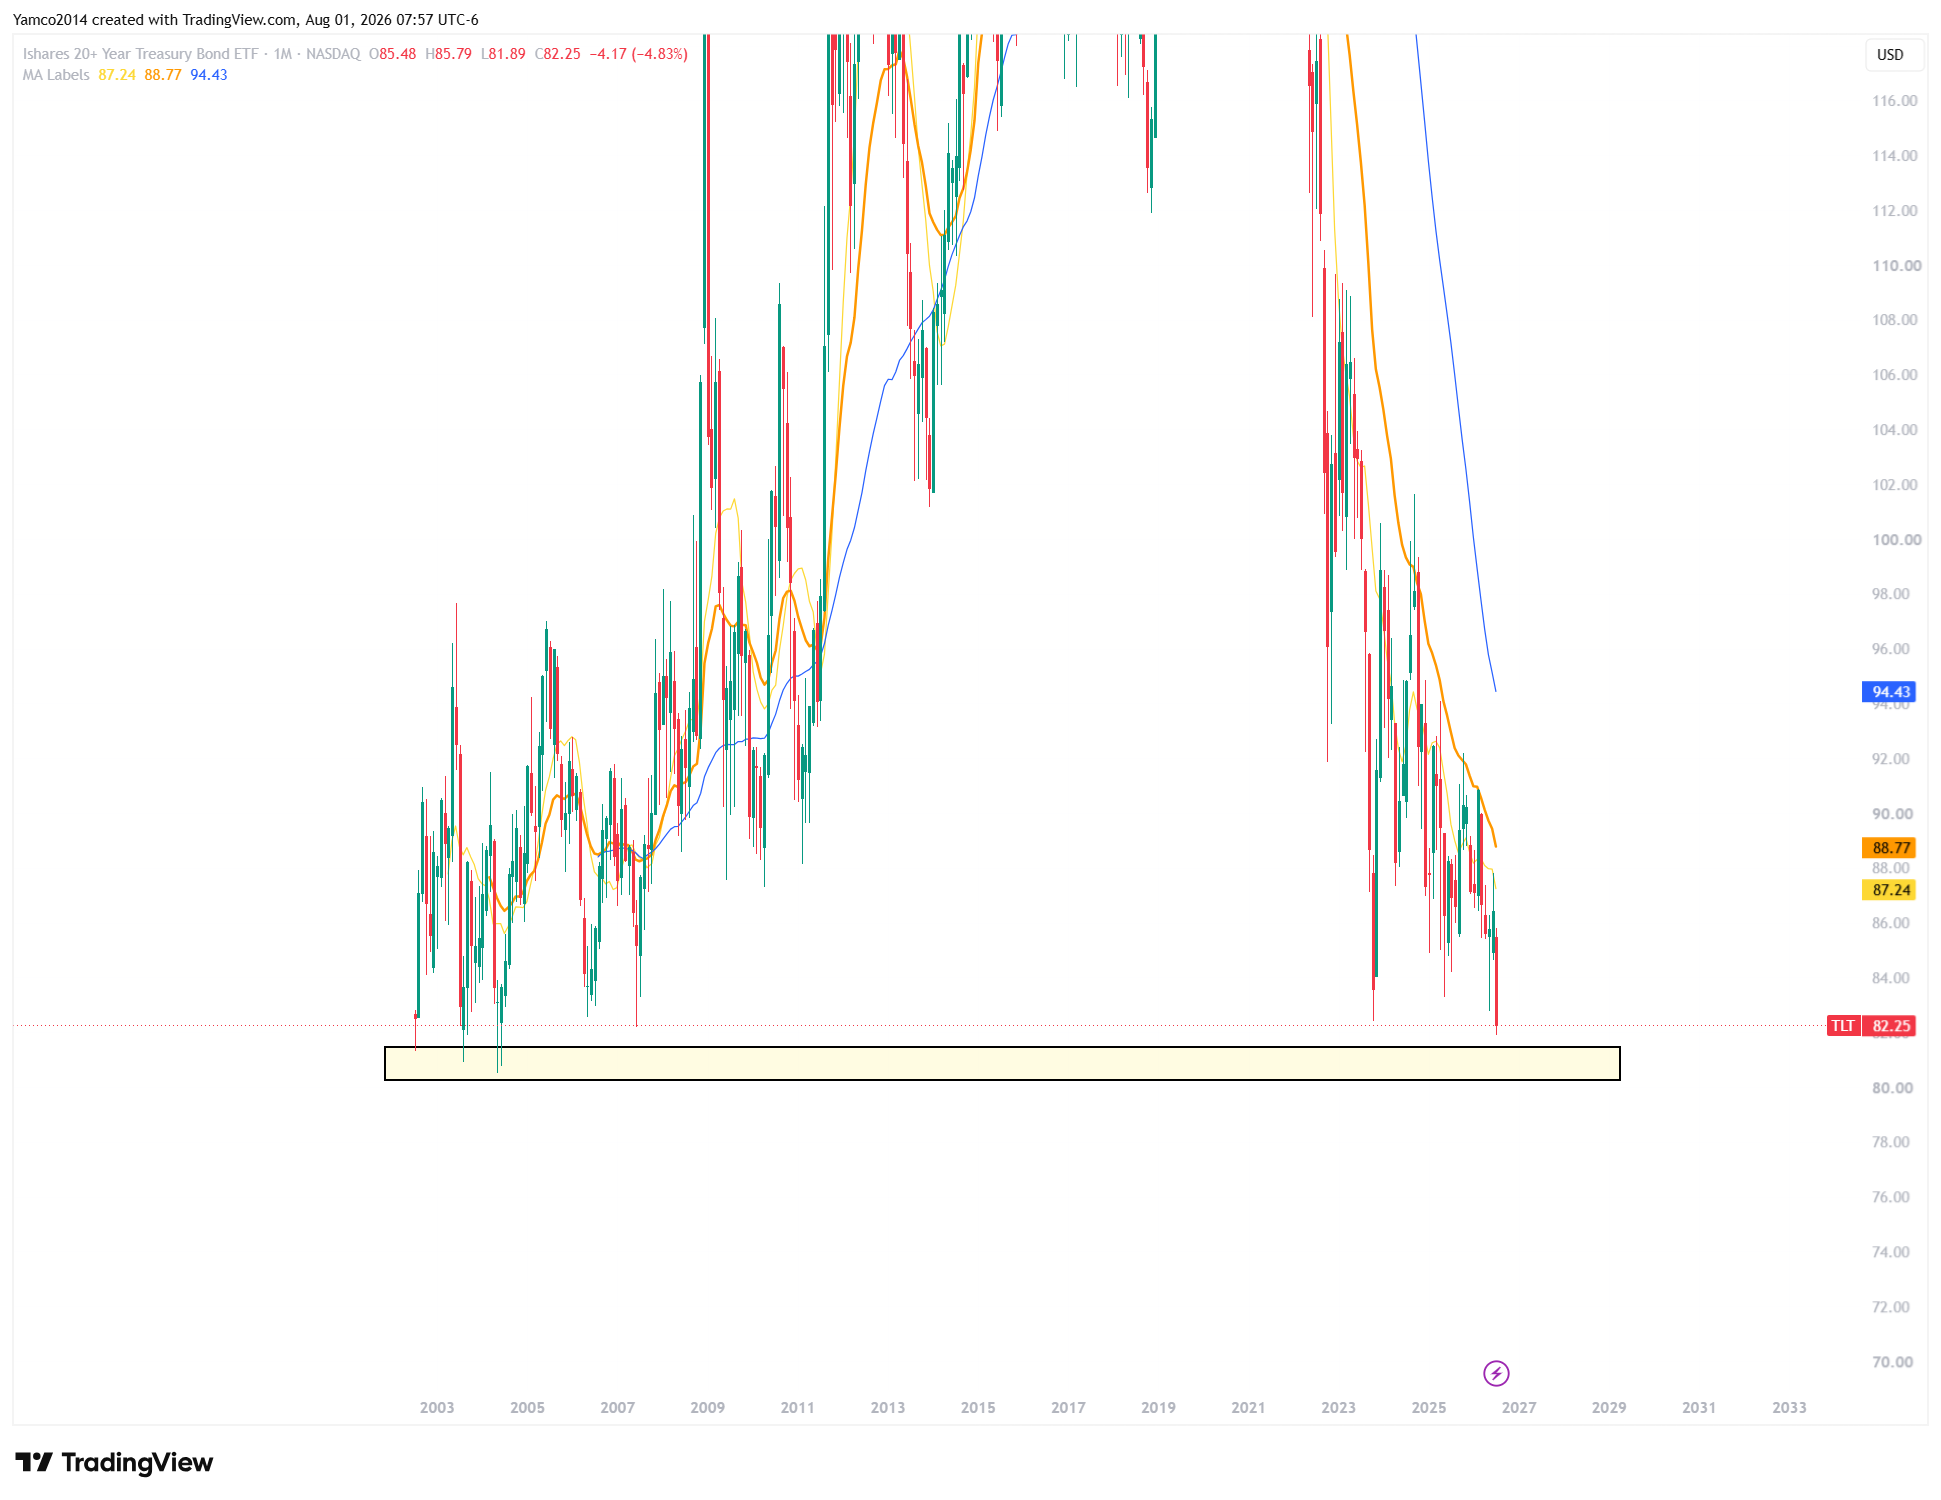
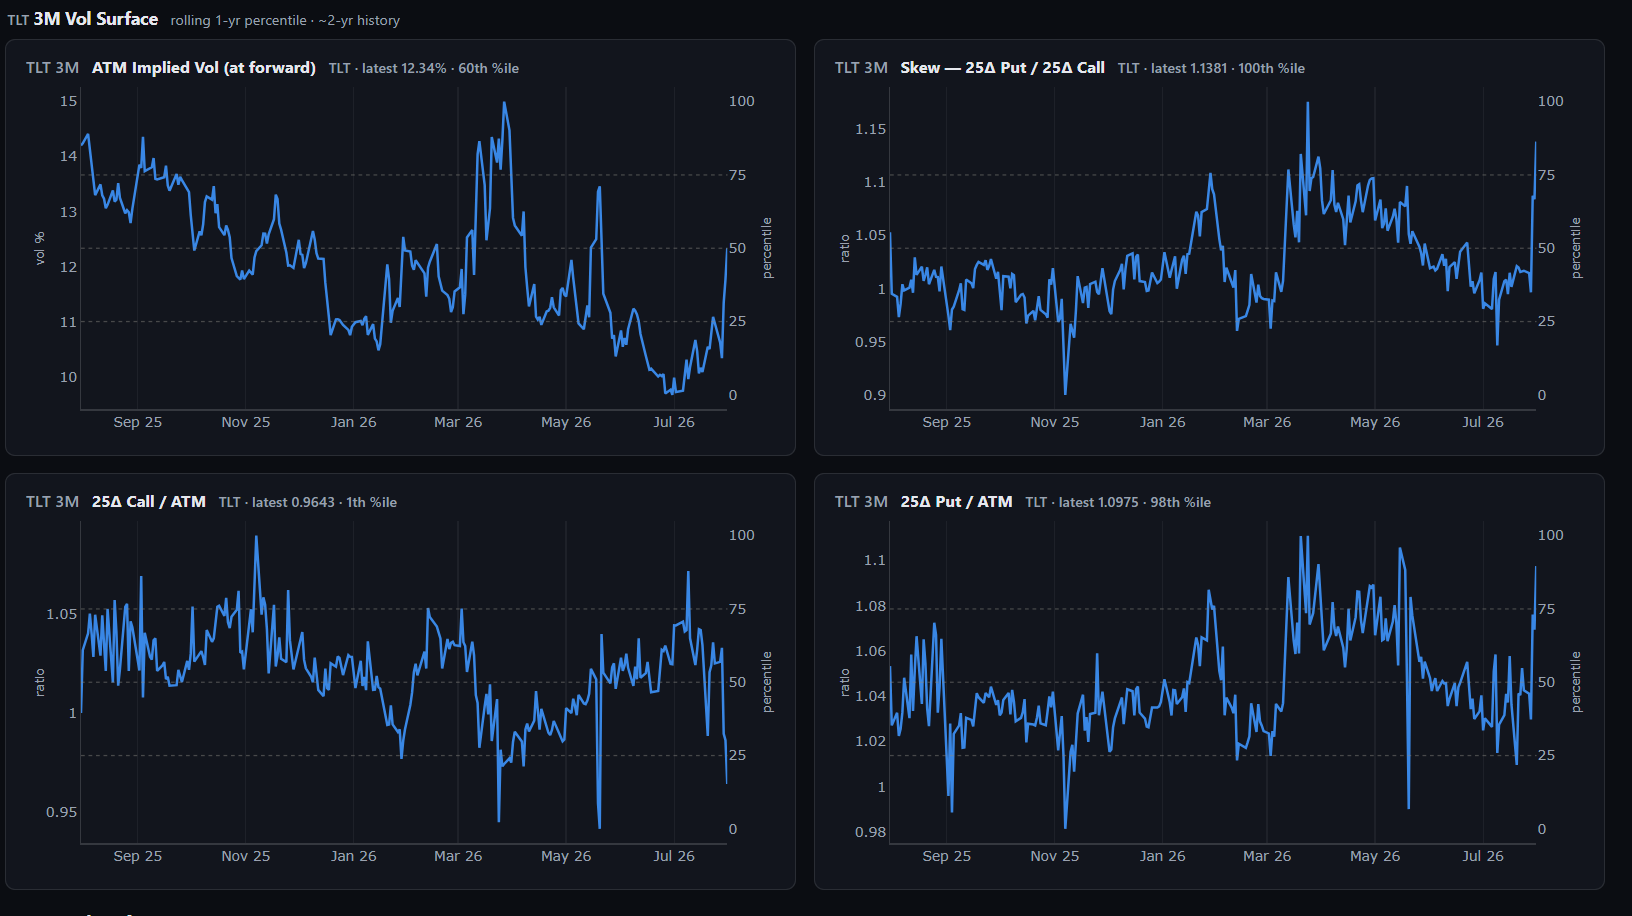
This is setting up for a major reversion long at some point given how loud rate twitter is and how heavily skewed TLT. As soon as rate twitter says it’s all over - this is a LT long.
3M Forward Skew
Key zones to watch (SPX)
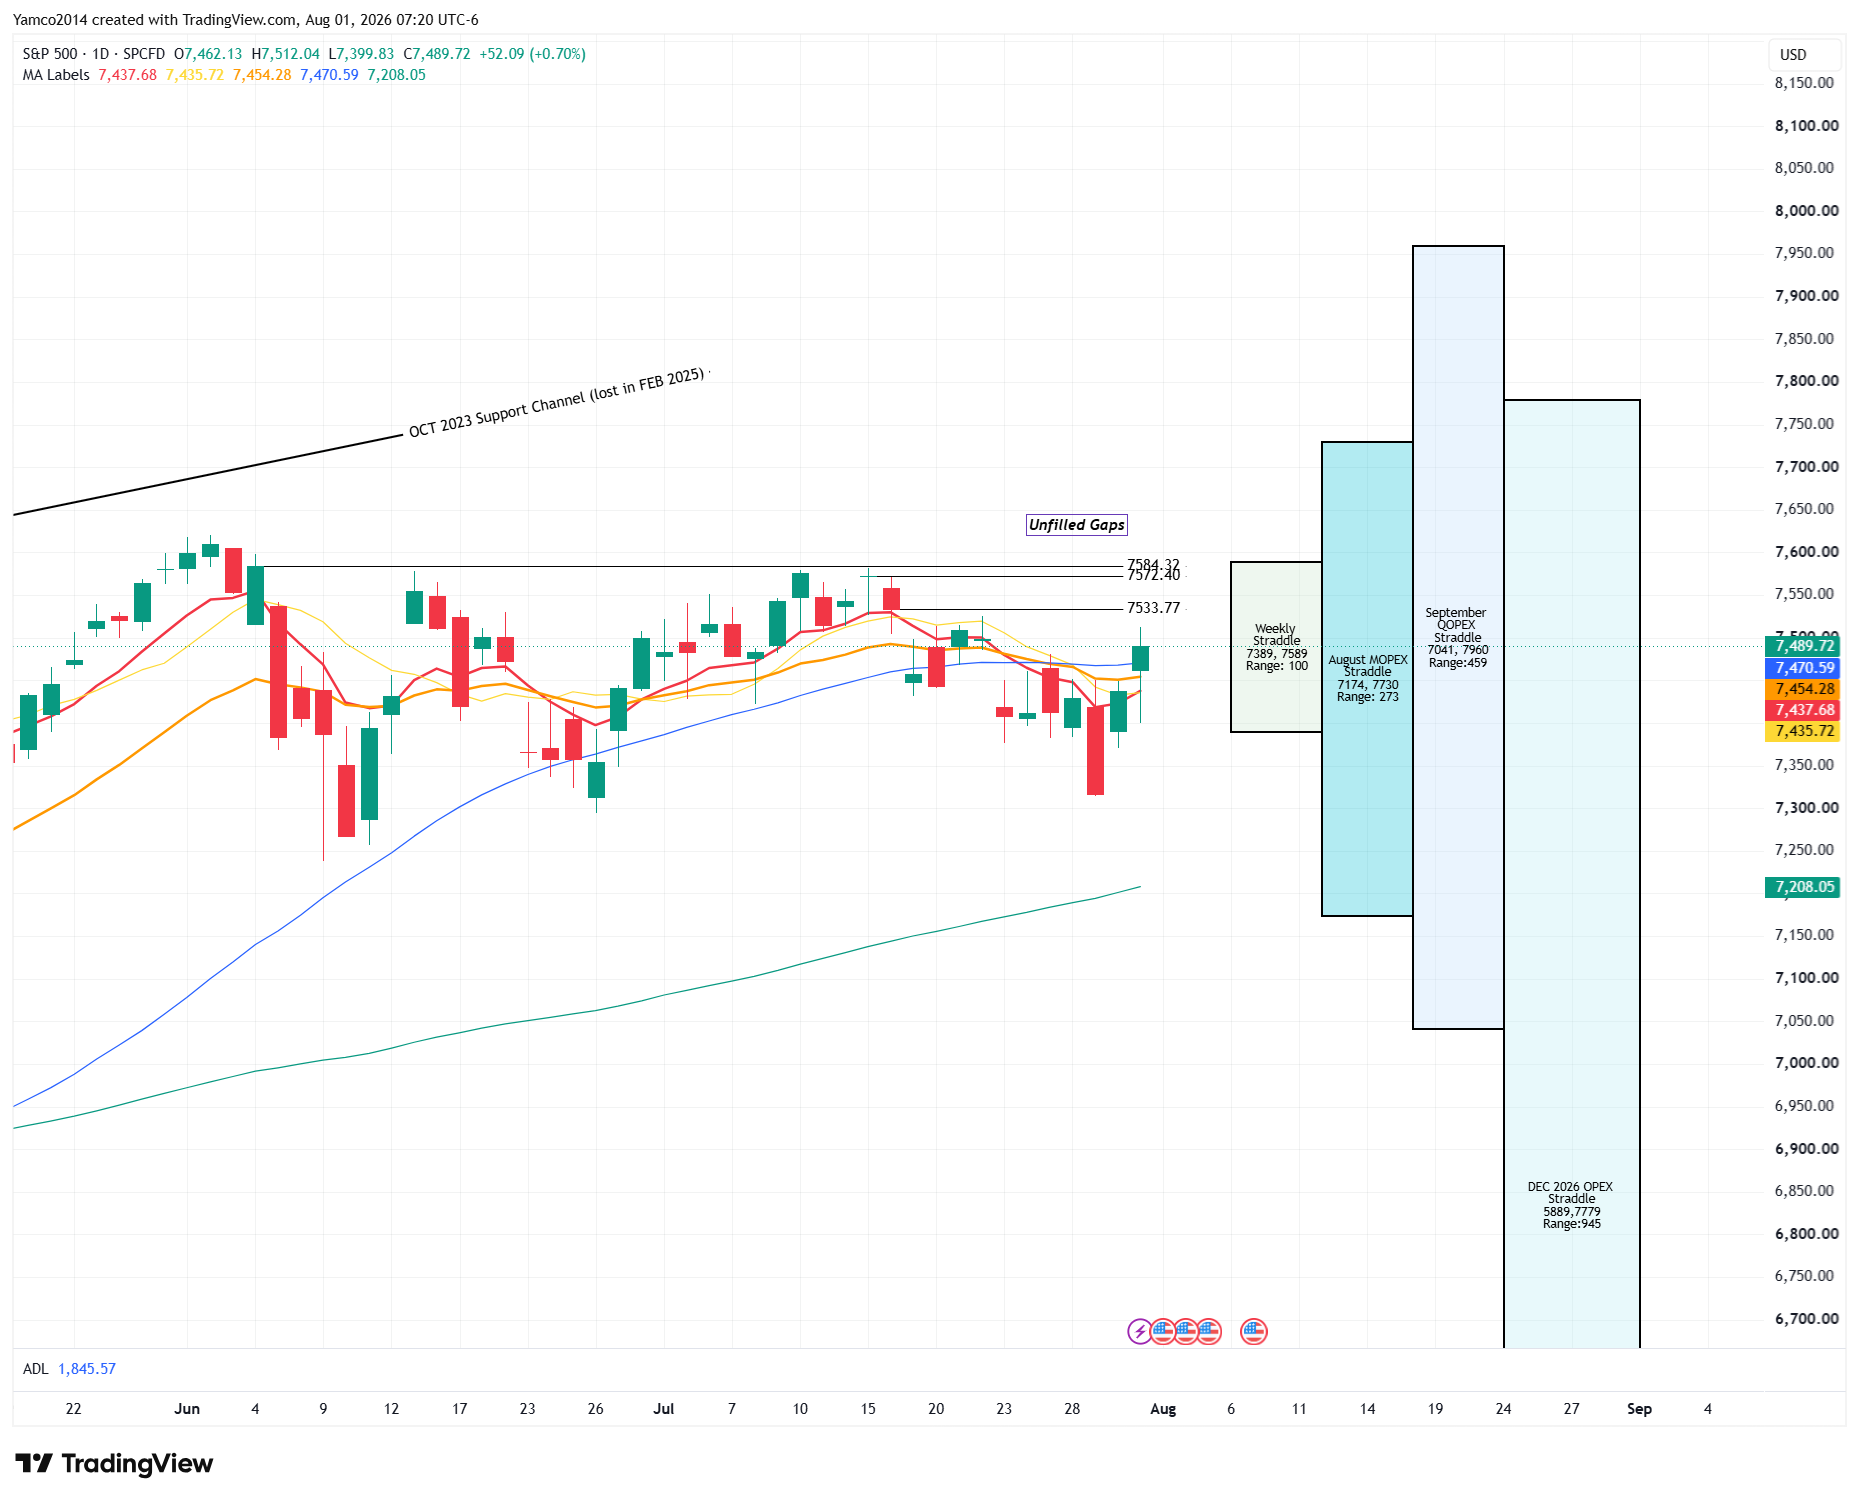
Let’s put some key moving averages on the chart and look at some basic straddle ranges (Weekly,Month end to Month end, Opex to Opex, QOpex to Qopex, DEC OPEX to DEC OPEX). A few unfilled gaps to the upside to watch for reactions.