


Positioning and Week Ahead [06-16]

Weekly Review was published separately here:

Looking into next week, we have several big events (taken from Investing.com) but
the main event continues to be Iran/Israel for now, but tariffs and the tax bill remain an ongoing issue.
Sunday (06/08)
Chinese Unemployment (2200)
Monday
20 Year Bond Auction (1300)
BOJ Interest Rate Decision (2300)
Tuesday
Core Retail Sales (BMO)
Industrial Production (0915)
Business Inventories (1000)
GDPNow (1300)
Wednesday [Touch Grass]
EUR CPI (0500)
US Crude (1030)
FOMC (1400) ~ Dot Plot Refresh
FOMC Press Conference (1430)
Thursday
Markets Closed
US Jobless Claims (0830)
BOE Interest Rate Decision
Friday
Quarterly OPEX
How significant are these events?
Well, we can use the straddle pricing to see the general jumps in pricing. See below
Positioning into the next week
I’ll go over each topic and summarize how I bring all this together at the end
Topics covered
DX & GX Surfaces
Straddles with 50/70 percent ranges
15/25/40 Delta Skew by Date
Term Structure
Net positioning (Aggregate and by day)
Technical Structure of the Market
Key zones to watch
Putting it all together
DX and GX Surfaces
DX Surface

Current DX Surface shows we’re in this small area where dealers will not sell on spot movements. As of now… Looks like below 5925 is a dealer sell while above 6k is a dealer sell.
GX Surface

We’re currently sitting just above a negative gamma environment.
VIX is up ~25% this week so let’s look at how a shift down in volatility does to these surfaces.
DX Surface with Vol Shift Down

The DX Surface flattens greatly with dealers selling below 5900 and above 6070 giving us this current estimate to drift in a larger range.
GX Surface with Vol Shift Down

Nothing really changes except for ranges far above spot into this Quarterly OPEX.
Straddles with 50/70 percent ranges

The straddle for this next week is109.8 pts for PM Expiration giving us a range of [5875,6085]. Tuesday appears to be the largest net increase to the straddle but the increase between days is relatively stable.
The June OPEX straddle as of Friday’s May OPEX PM close is [5740,6175]. The reason I like to bring these straddles up is they provide a benchmark from period to period for price expectations as many market participants buy/sell straddles for OPEX to OPEX, Week to Week, and even Day to Day.
The 25 delta puts are price much higher for the back half of the week while the 15 delta positions are significantly higher to the downside - Traders are focusing on crash protection here!
If you’re curious how I came to that conclusion, the inner blue/yellow numbers are the 25 delta ranges while the outer blue and yellow numbers (additive to the inner) represent the 15 delta ranges.
The 70% Range for each day(or week) can be obtained by adding the two yellow numbers together while the lower number can found be adding the two blue numbers together and the range inside of these numbers is equal to the 70% range.
Quick example….

Using Friday PM’s Values
The 70% range is [5790,6092] and you can see that the downside range is ~ 75% higher than the upside range!
Skew
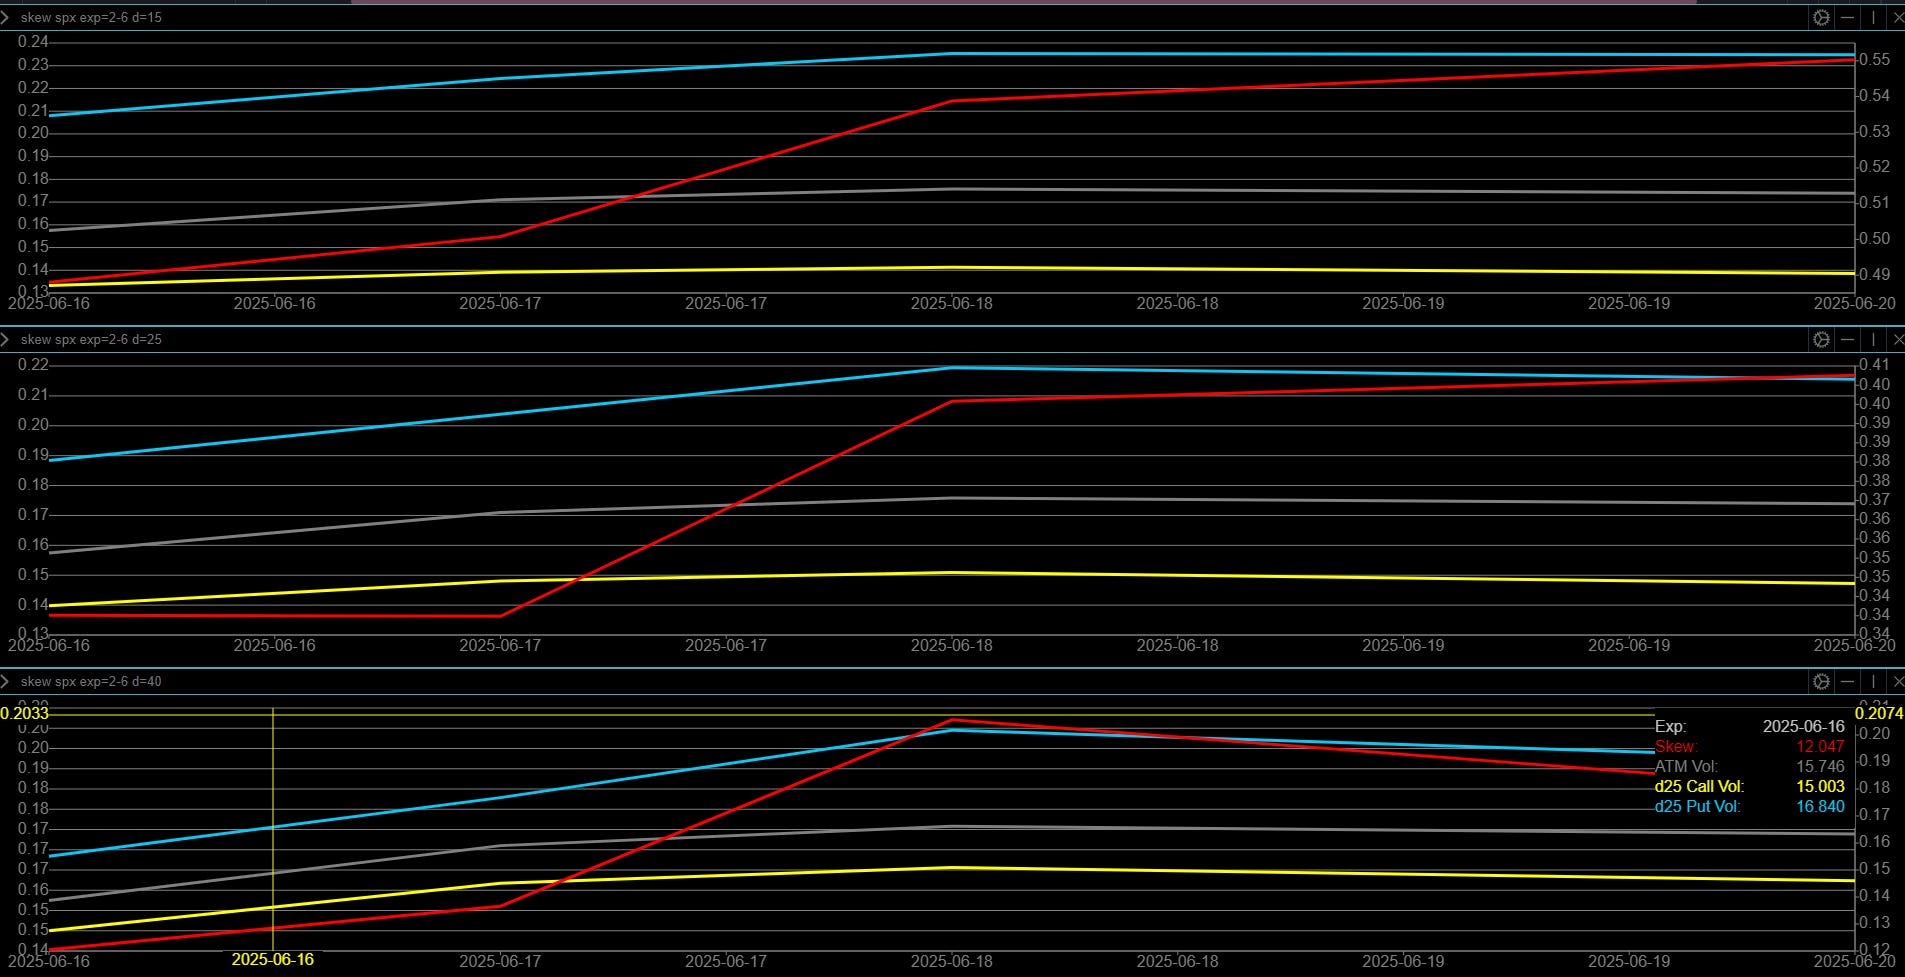
Orientation of charts
15 delta = top (OTM) and is often the place for speculative upside/downside. It’s a bit wingy but not quite as wingy as a 5 delta.
25 delta = middle (slightly less OTM) and is often the relative delta for hedges
40 delta = slightly out of the money and is often the relative delta for directional moves
Orientation of data in charts
Gray = ATM volatility (general demand in volatility)
Yellow = Call volatility
Blue = Blue volatility
Red = Skew
Observations
ATM volatility climbs into Wednesday and remains elevated with a very slightly increase after Wednesday (FOMC).
Term Structure

Term structure (as of Friday close) is now back at the relative highs for the past 15 days.
This shouldn’t be a surprise to anyone as the middle east heats up yet again. If this event vol comes off, there’s a strong chance we get a snap back rally. On the flip side - As long as volatility remains elevated, the daily ranges will remain elevated.
Net positioning (Aggregate and by day)
Aggregate
This next week boasts an environment with nearly the same put/call exposure. This is a simple OI view. Into OPEX, the net exposure leans more bearish.

From left to right
OI - Simple OI from Friday morning (just to show magnitude of positioning).
Volm_BS - Today’s volume aggregated by buy/sell
Orientation
Blue = Put
Yellow = Call
Above X Axis = Net Bought
Below X Axis = Net Sold
Volm - Today’s aggregate total volume
This next week is dictated by headlines but for now I’d imagine upside is generally capped at 6050 and downside expansion happens this week barring a resolution to the ME.
Notes [This graphic is aggregated through Wednesday]
On the wings, volatility is well supplied through Wednesday while inside the weekly straddle range, there’s quite a bit of dealer short gamma

Friday (combined)
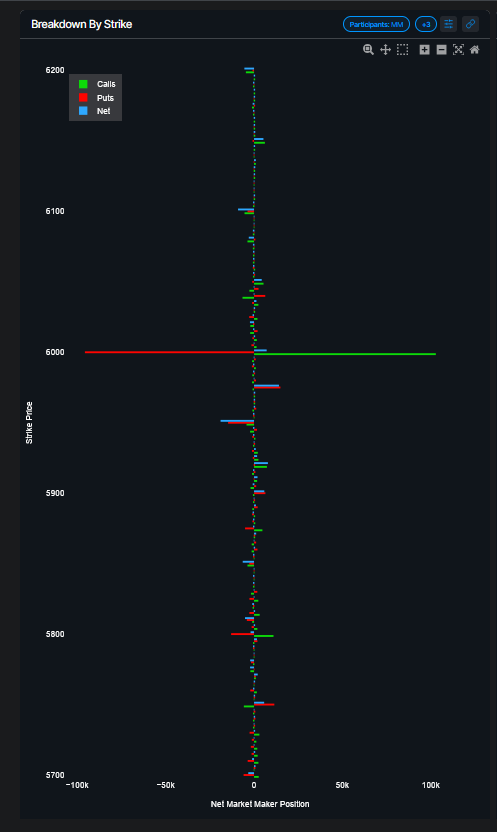
There is a large 15k 5975/5950 credit spread for Friday and an extremely large synthetic short at 6k.

has an explanation which I’ve copied and pasted below
Combinations
Positive Delta, Positive Gamma - Then dealers net long calls
Negative Delta, Negative Gamma - Then dealers are short calls
Negative Delta, Positive Gamma - Then dealers are long puts
Positive Delta, Negative Gamma - Then dealers are short puts
Technical Aspects of the Market
Before I cover key zones to watch, let’s look at some technical aspects of the market.
S&P Stocks above 200D average

Current reading is 47.42 down slightly from last week’s 49.2 which is generally in the middle of the range for the past ~2 years. If you look at how this metric pulls back, It looks like we’ve gotten a smaller pullback across the market while the market has had quite the V recovery from April lows.
S&P Stocks above 50D average

Current readings is 70.43 down slightly from last week’s reading of 72.61. This metric shows a large portion of the market is above the 50D. I’m sure this metric remains elevated given that 50 market days ago was April 4th.
S&P Stocks above 20D average

Current reading is 40 down quite a bit from last week’s reading of 61. I feel like this is more representative of the current market structure than the percentage of stock over the 50D given the technical nature of the market we have observed. This value is pretty far below the 50D average of this metric and could definitely go lower.
Total Put/Call Ratio (CPC)

This metric is in the middle of the range with a reading of .81 down from .87. My general take away here is the market was generally looking for ATHs and generally hedged/neutral hedged on the overall market. We have VIXEX this week and Quarterly OPEX so let’s see how this evolves.
CBOE VIX Volatility Index (1 month forward volatility of VIX)

The 30 day forward volatility of VIX is back to elevated levels from the relative lows we saw last week relative low levels.
Last week I noted, “I think VIX calls represent a better hedge than puts at these levels as VIX is likely to stall here in the mid 16s and we can likely see some spot up/vol up dynamics as we approach highs.”
Key zones to watch
In no particular order, we have a few big zones on the chart to watch.
First…. We’re in an environment of high volatility driven by headlines so these levels are going to be wide
From low to high:
5560: April 1 Lows
5570: Weekly Straddle Low
5575: Mar 2025 & Tariff Day Swing low
5610-5615: FOMC supportive downtrend.
5635-5645: AUG/SEP 2024 Highs
5660-5680: Tariff Breakdown Level
5710: Pre-election Lows & MAR 2025 Swing high (several times)
5750: Early March Lows & 50W MA
5775: Mid-January 2025 Low, Late Mar 2025 High, Election Gap Bottom; Weekly 21 EMA
5805: 200D MA
5810 - Mid January Low Cluster
5850: Post Election Lows, January 2025 Lows, MAR 2025 Breakdown, Weekly 8 EMA area [5837]
5900-5905: Upper range of post election pull backs
5920: 21D EMA (Bounced here Friday Night on Israel/Iran Escalation) [This is your level to ease up leverage if you’re a short term leveraged swing trader]
5940-5950: Late February Breakdown, early February gap support
6000: Post Election NOV highs, Swing High Early Jan
6050: Post FOMC early Jan Swing High, FOMC Breakdown
6100: Lower level of ATHs
6150: ATHs
Let’s Put these on the chart

Each of these identified levels is a guide to price action to watch into the next week.
They might each cause an extreme response as a squeeze might accelerate or a new sell off might begin.
Tie it all together
Straddles and 15/25 delta pricing are showing increase volatility expectations with 15 delta puts showing a concern of sharp downside expansion.
Realized Volatility has bottomed and is prone to expansion into VIXEX and geopolitical uncertainty. As volatility expands, we could see a bit more vol expansion due to positioning into the market.
Term Structure shows highest expectations for volatility moving forward.
Net Options positioning shows a generally wide range of bought positioning around spot with net sold positions at the wings.
Technical environment shows that near term, the market is correcting under the hood with the percentage of stocks below the 20D under the average while longer dated technical indicators (% of stocks over 200D and 50D) are higher due to the dates these indicators are covering.
Summarizing the above, I think there’s a chance we see instability in the market but currently believe it will be bought back up. Obviously this can change with headlines.
On to the position updates, and trades I’m watching.
Keep reading with a 7-day free trial
Subscribe to Yamco to keep reading this post and get 7 days of free access to the full post archives.